
Organizational Physics Audio Book Visual Materials
![]() This page contains visual materials for audio book listeners. Enjoy the book!
This page contains visual materials for audio book listeners. Enjoy the book!
How to Read this Book
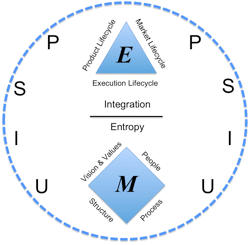
Figure 1. Organizational Physics Strategy Map
Chapter 1
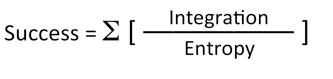
Figure 2. The Universal Success Formula
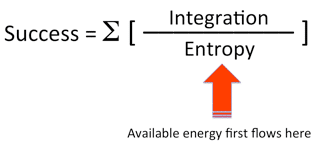
Figure 3. Available energy first flows to manage entropy needs

Figure 4. High entropy steals from high success

Figure 5. A decrease in entropy allows the system to have more energy for top-line performance
Chapter 2

Figure 6. The Vector of Happiness and Productivity
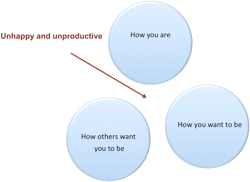
Figure 7. The greater the gap, the more unhappy and unproductive you are

Figure 8. The narrower the gap, the greater the happiness and productivity
Chapter 3
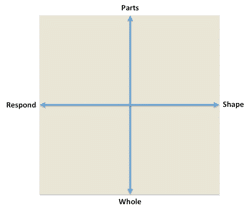
Figure 9. The Adaptive Systems Model provides a universal framework for understanding individual and collective behavior
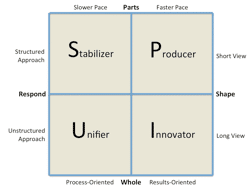
Figure 10. The four forces of Organizational Physics
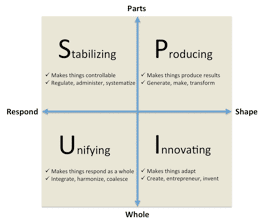
Figure 11. The four styles
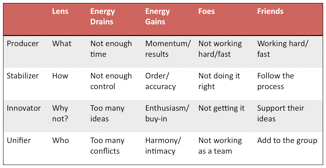
Figure 12. The friends, foes, gains, and drains for each style
Chapter 4
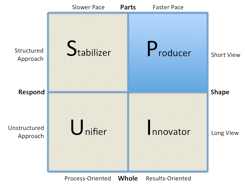
Figure 13. The Producer Style
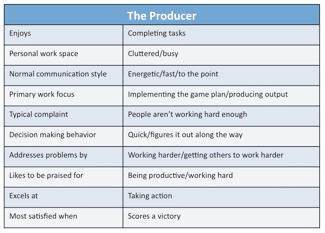
Figure 14. Traits of the Producer Style
Chapter 5
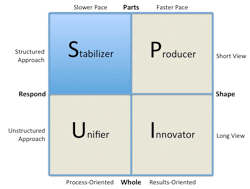
Figure 15. The StabilizerStyle
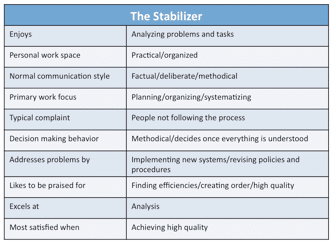
Figure 16. Traits of the Stabilizer Style
Chapter 6
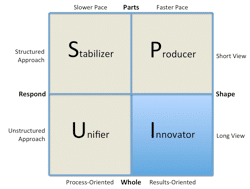
Figure 17. The Innovator Style
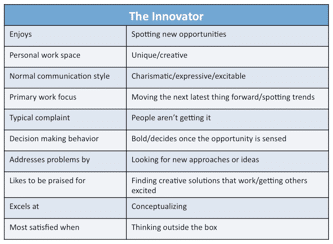
Figure 18. Traits of the Innovator Style
Chapter 7
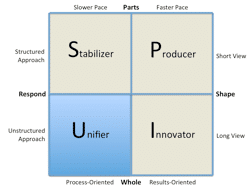
Figure 19. The Unifier Style

Figure 20. Traits of the Unifier Style
Chapter 9
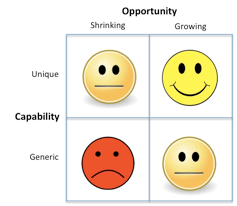
Figure 21. Not all opportunities and capabilities are created equal
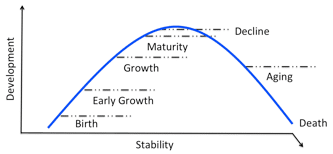
Figure 22. Everything follows a lifecycle
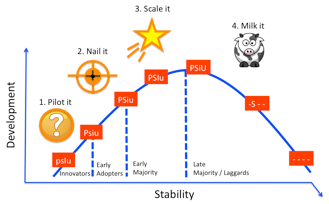
Figure 23. Aligned Product, Market, and Execution Lifecycles
Chapter 10
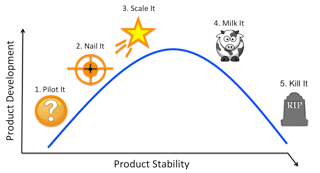
Figure 24. The stages of the product lifecycle
Chapter 11
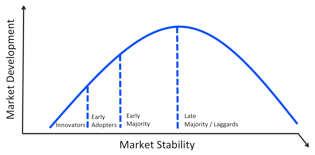
Figure 25. The Market Lifecycle
Chapter 12
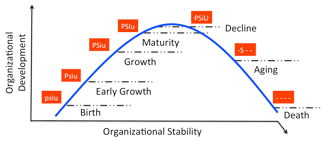
Figure 26. The stages of the Execution Lifecycle
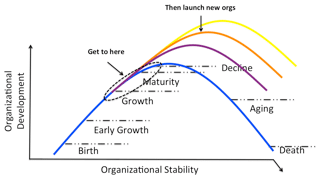
Figure 27. The goal of the Execution Lifecycle is perpetual renewal
Chapter 13
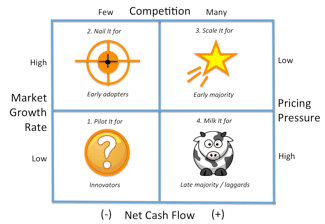
Figure 28. Four key metrics guide the timing and sequence of your strategy: market growth rate, competition, pricing pressure, and net cash flow
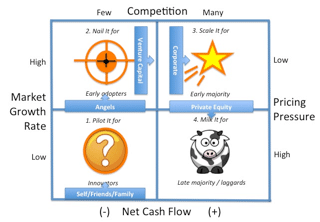
Figure 29. Typical investment capital timing and sources
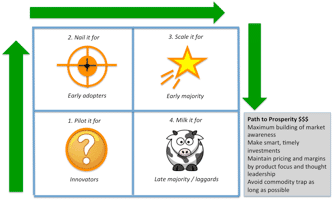
Figure 30. The Path to Prosperity goes the long way around
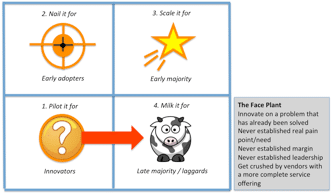
Figure 31. The Face Plant
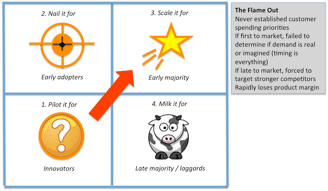
Figure 32. The Flame Out
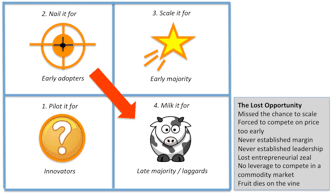
Figure 33. The Lost Opportunity
Chapter 14
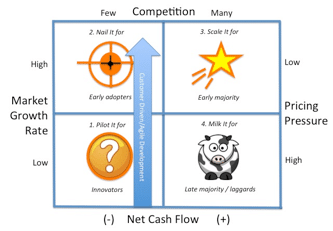
Figure 34. Customer-driven/agile development and lifecycle strategy
Chapter 15
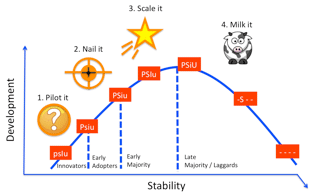
Figure 35. The Strategy Map

Figure 36. The Strategy Map in action (part 1)
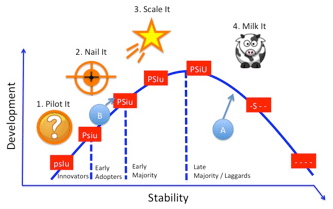
Figure 37. The Strategy Map in action (part 2)
Chapter 16
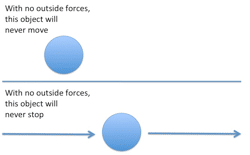
Figure 38. Newton’s first law of motion
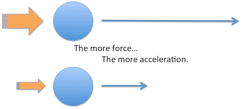
Figure 39. Newton’s second law of motion
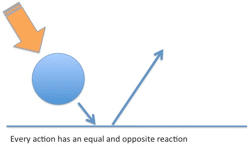
Figure 40. Newton’s third law of motion
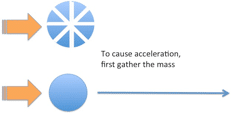
Figure 41. To create acceleration, first gather the mass
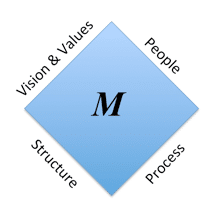
Figure 42. The Execution Diamond
Chapter 17
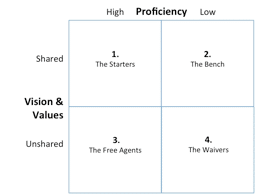
Figure 43. Who’s on your team?
Chapter 18
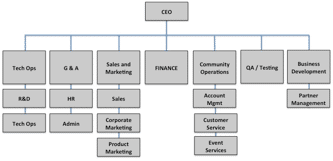
Figure 44. Structure done wrong. Can you tell what’s wrong with this picture?
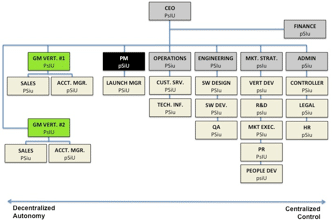
Figure 45. Structure done right. Can you tell how to scale this company?
Chapter 19
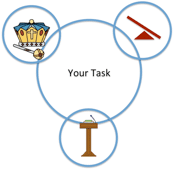
Figure 46. If your task if big, you’ll need to gather the authority, power, and influence to make it happen
Figure 47. Once you’ve gathered in the authority, power, and influence, it’s much easier to enact a change