
Designed to Scale Audio Book Visual MaterialsThis page contains visual materials for audio book listeners. Enjoy the book! Chapter 2 |
|---|
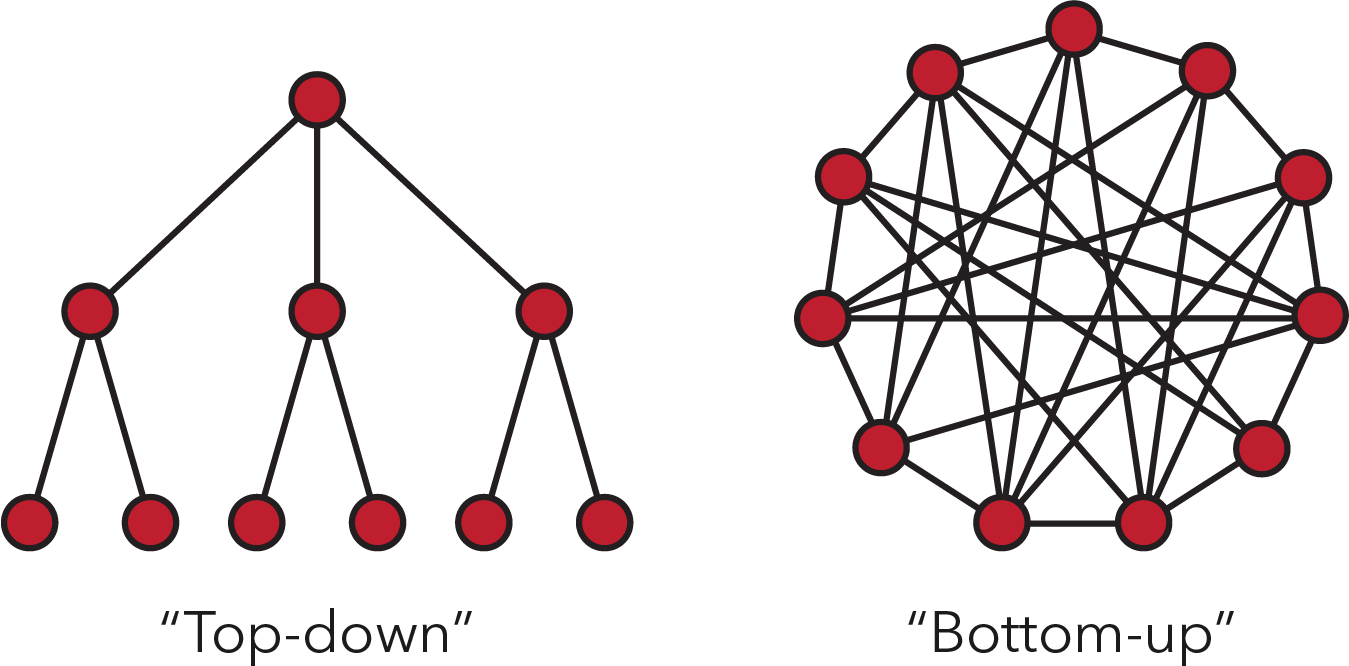 |
| Figure 1. Top-down vs. bottom-up structures. |
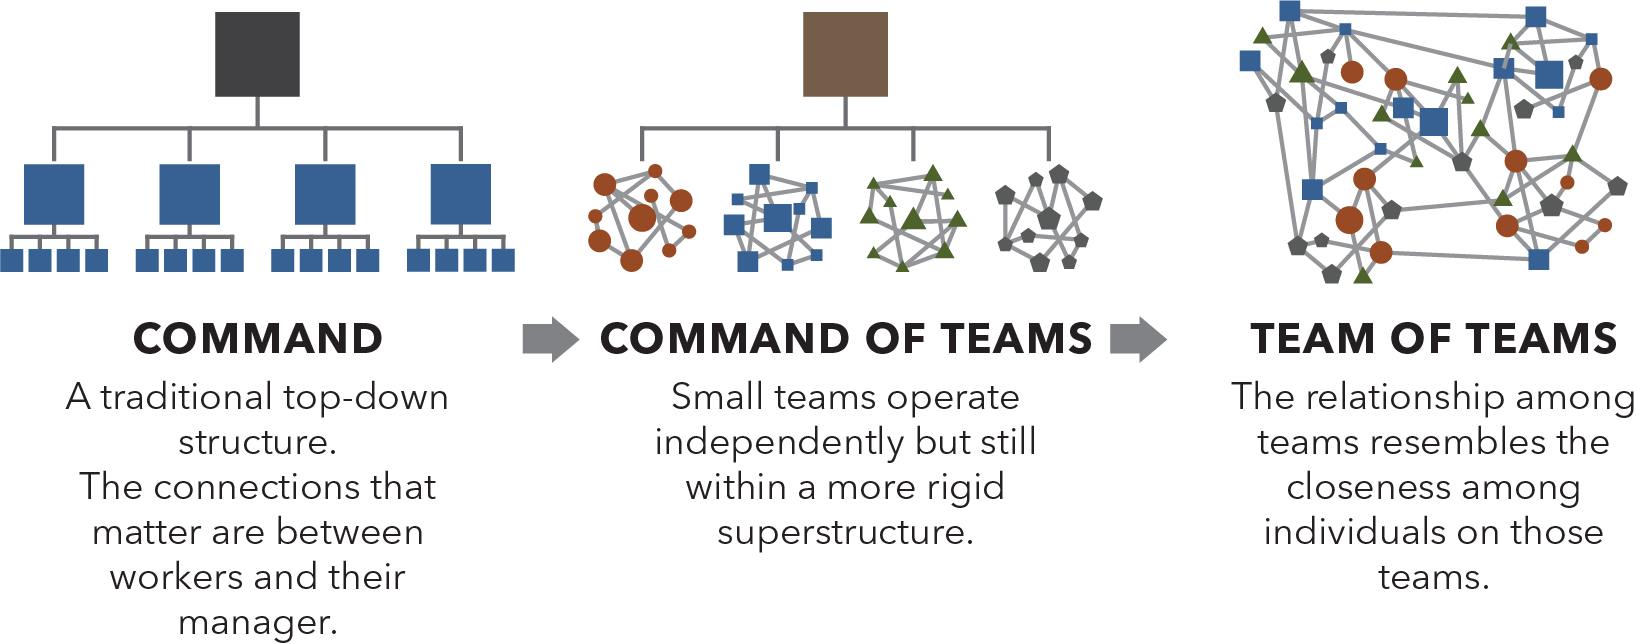 |
| Figure 2. Key concept behind self-managed organizations portrayed in Team of Teams. |
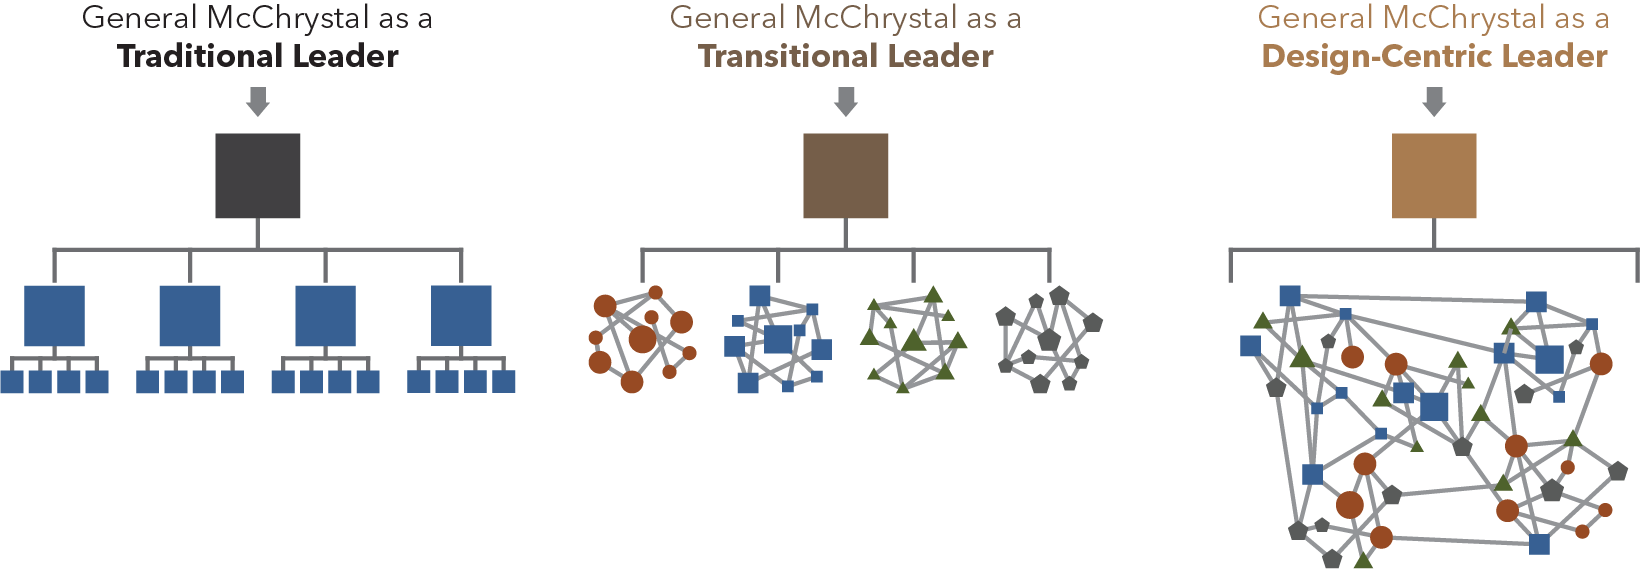 |
| Figure 3. An alternate story for Team of Teams is the journey of General McChrystal from a traditional command-and-control leader to a design-centric leader. |
Chapter 3 |
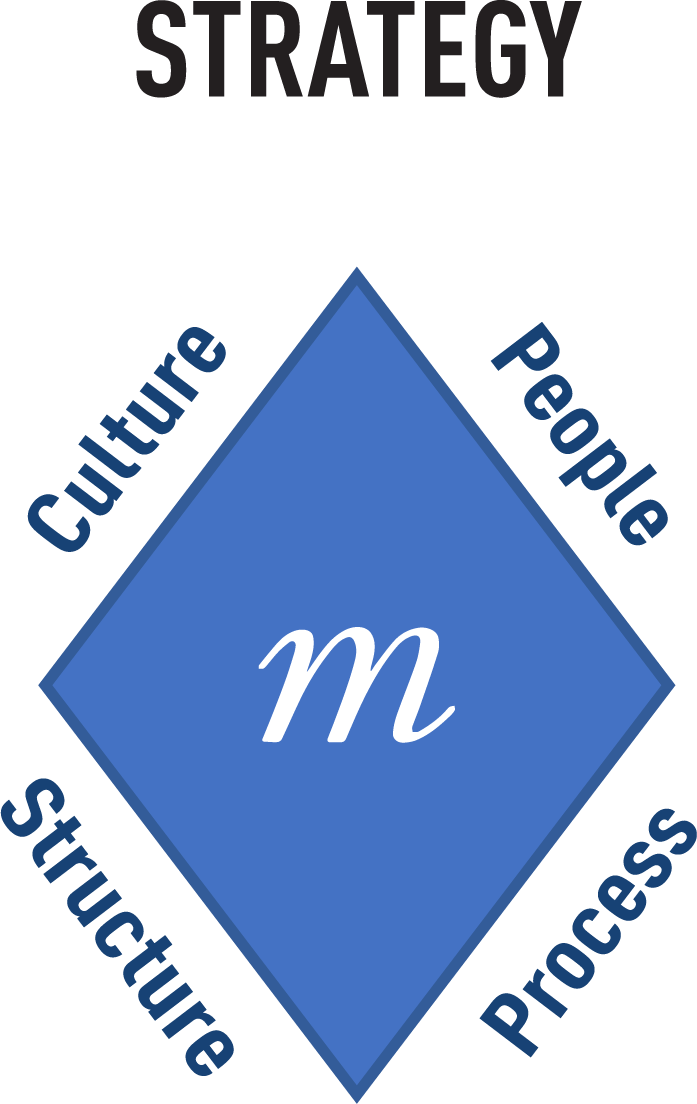 |
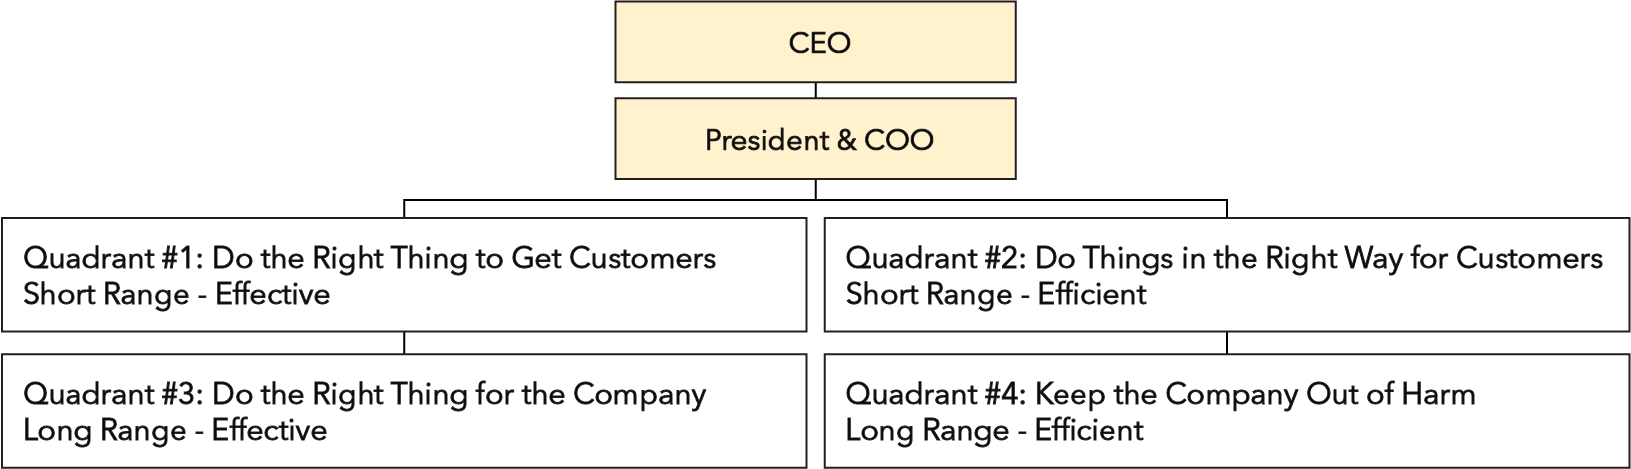
| Figure 4. The Organizational Physics Strategic Execution Diamond. |
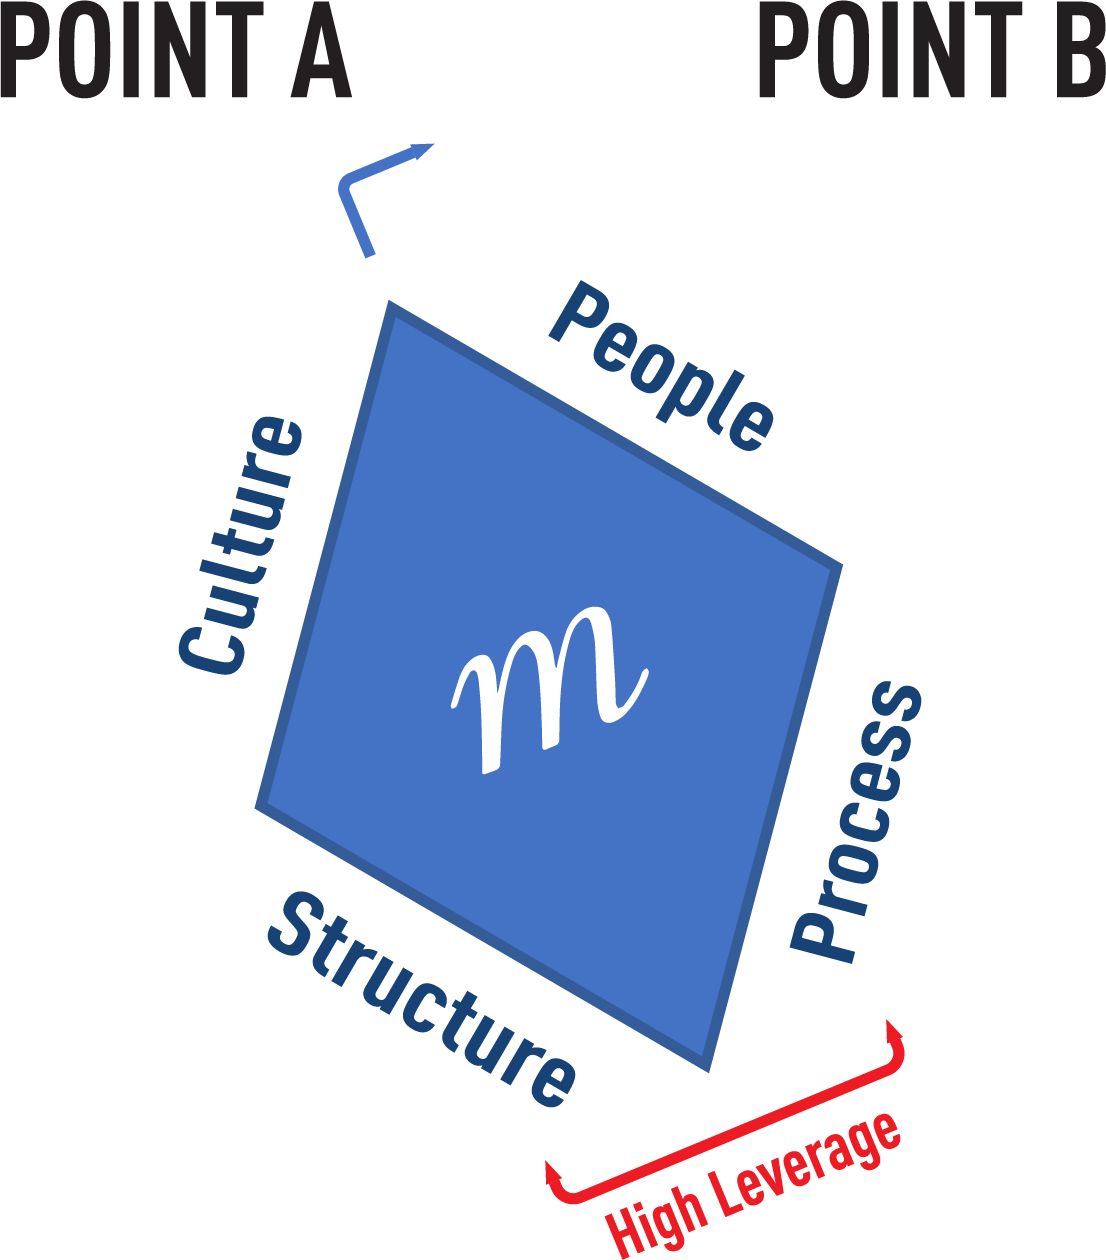 |
| Figure 5. Work at the level of Structure & Process to create higher leverage and turn the ship. |
Chapter 4 |
 |
| Figure 6. Top-down vs. bottom-up is not a problem to solve. |
 |
| Figure 7. Although some functions in the organization need to tilt toward the left side, the organization as a whole needs to tilt to the right side! |
Chapter 5 |
 |
| Figure 8. The Adaptive Systems Model of Organizational Physics. |
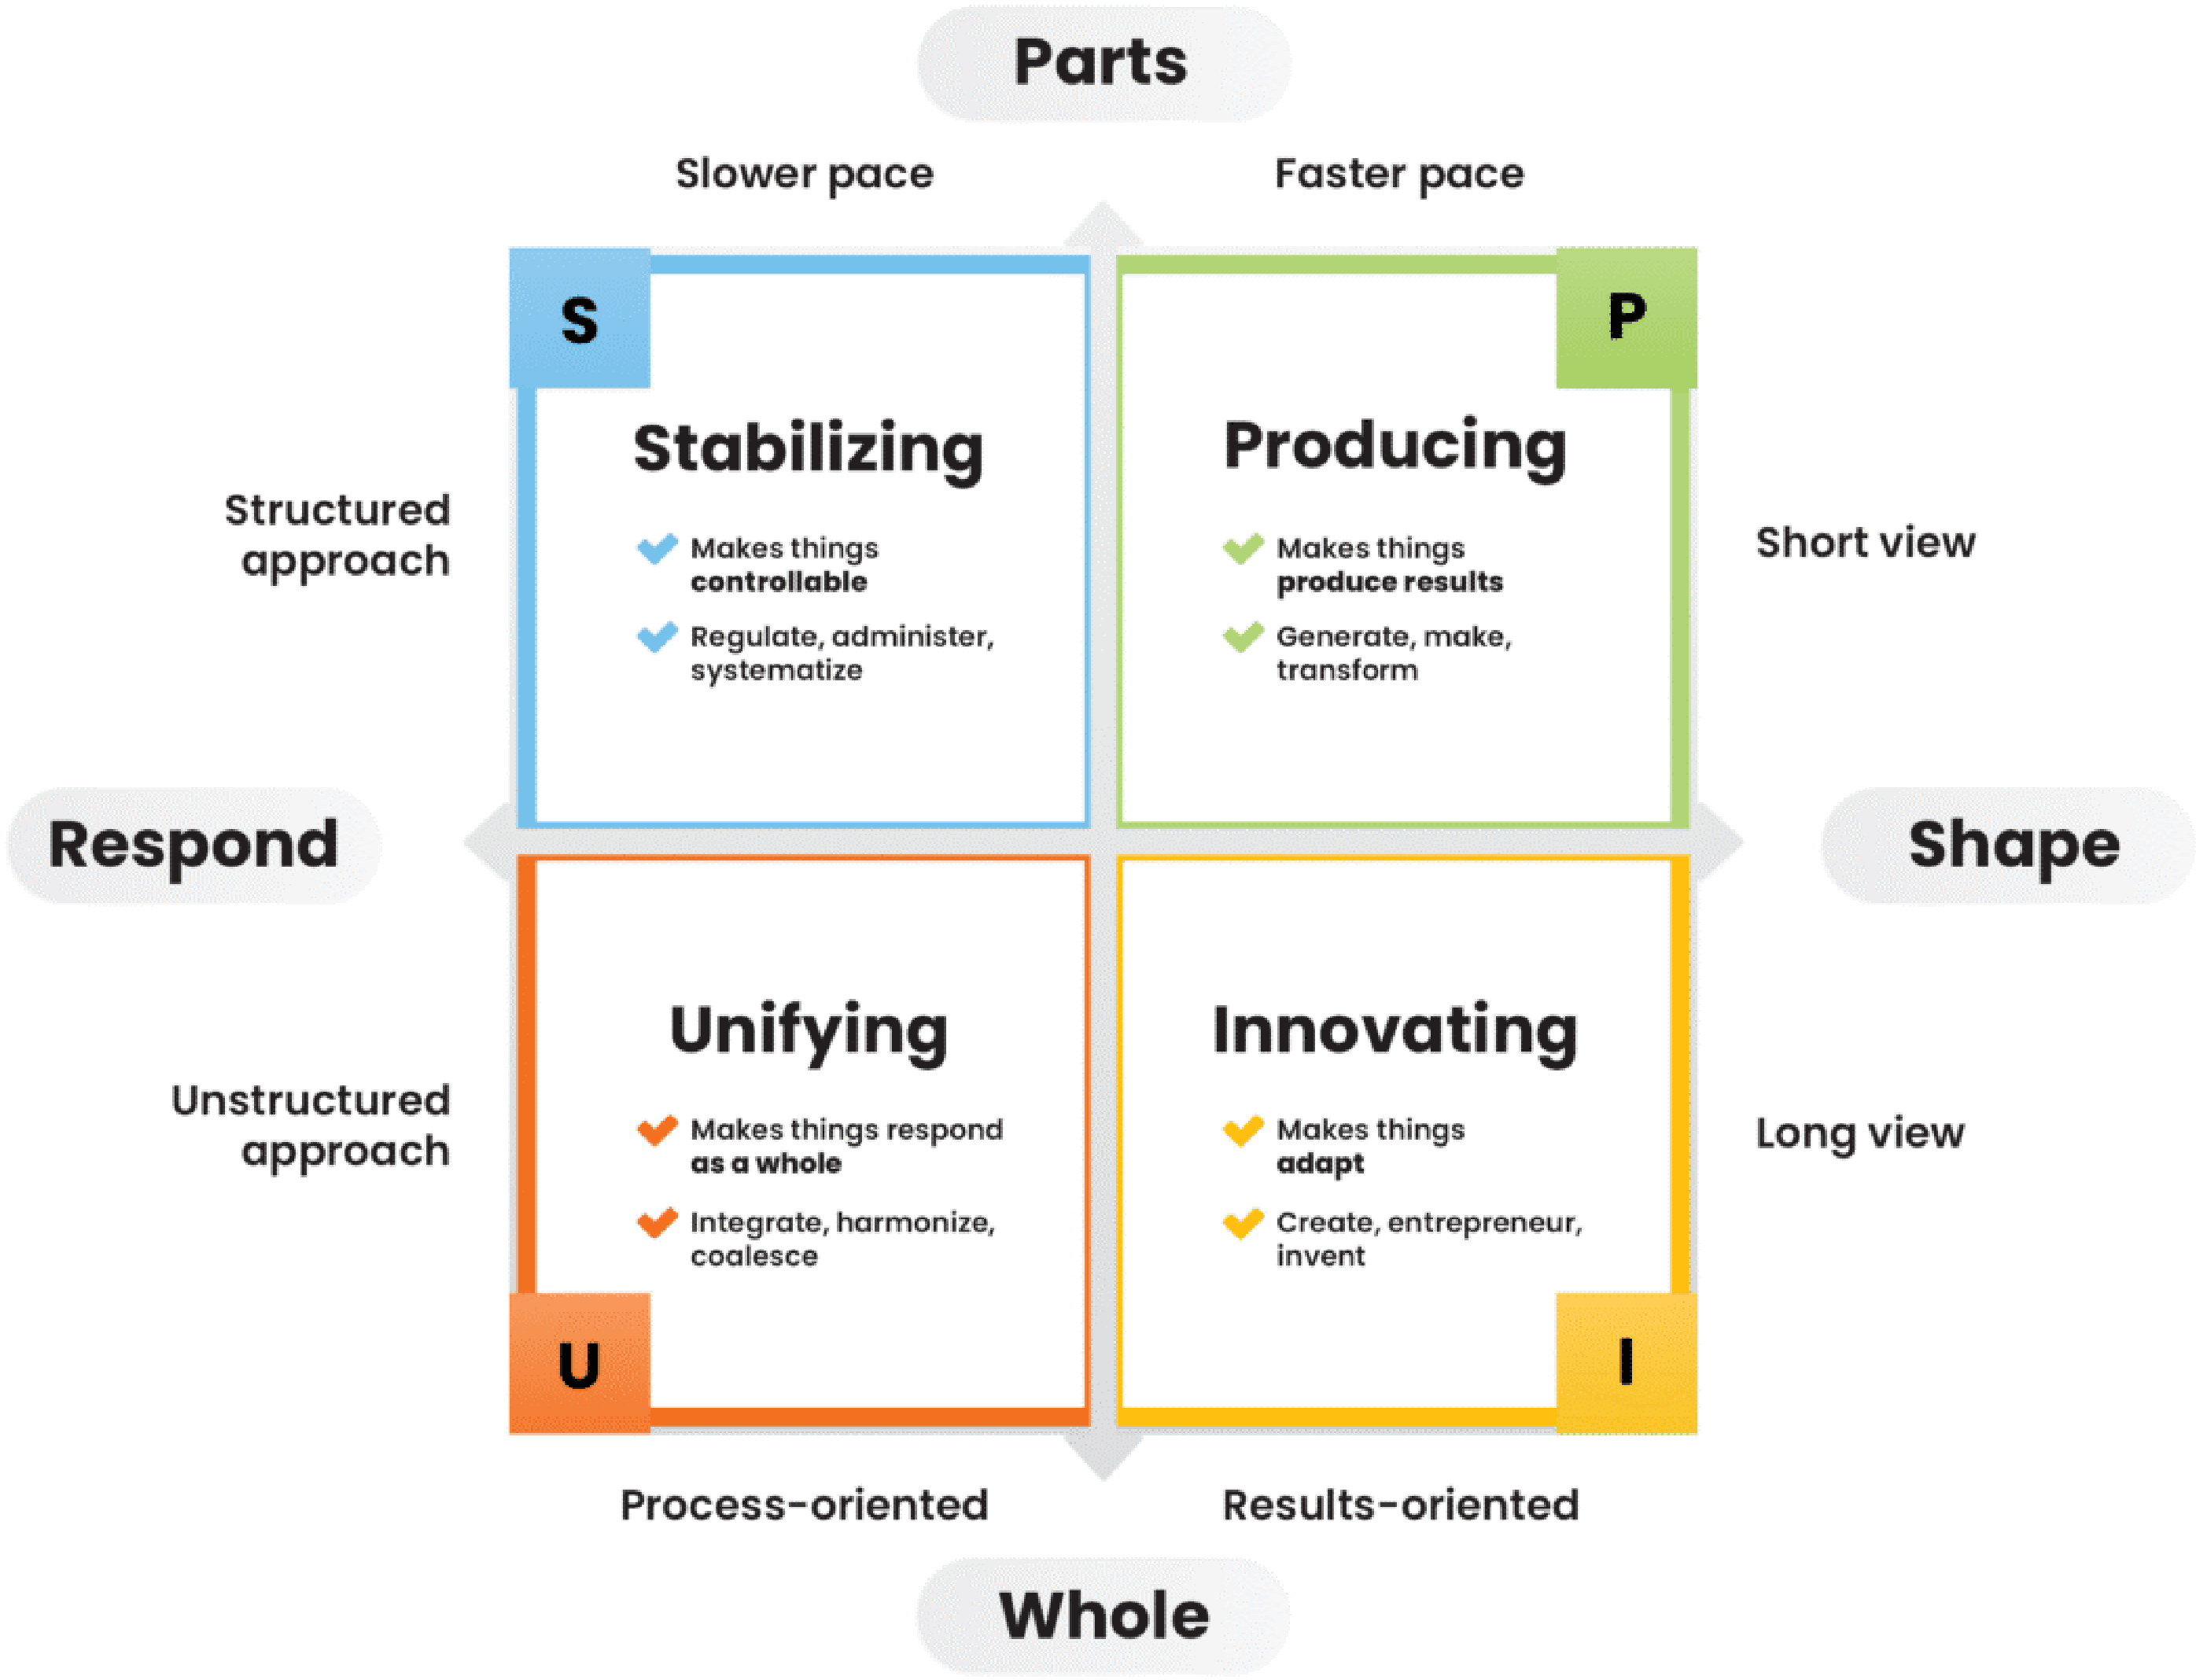 |
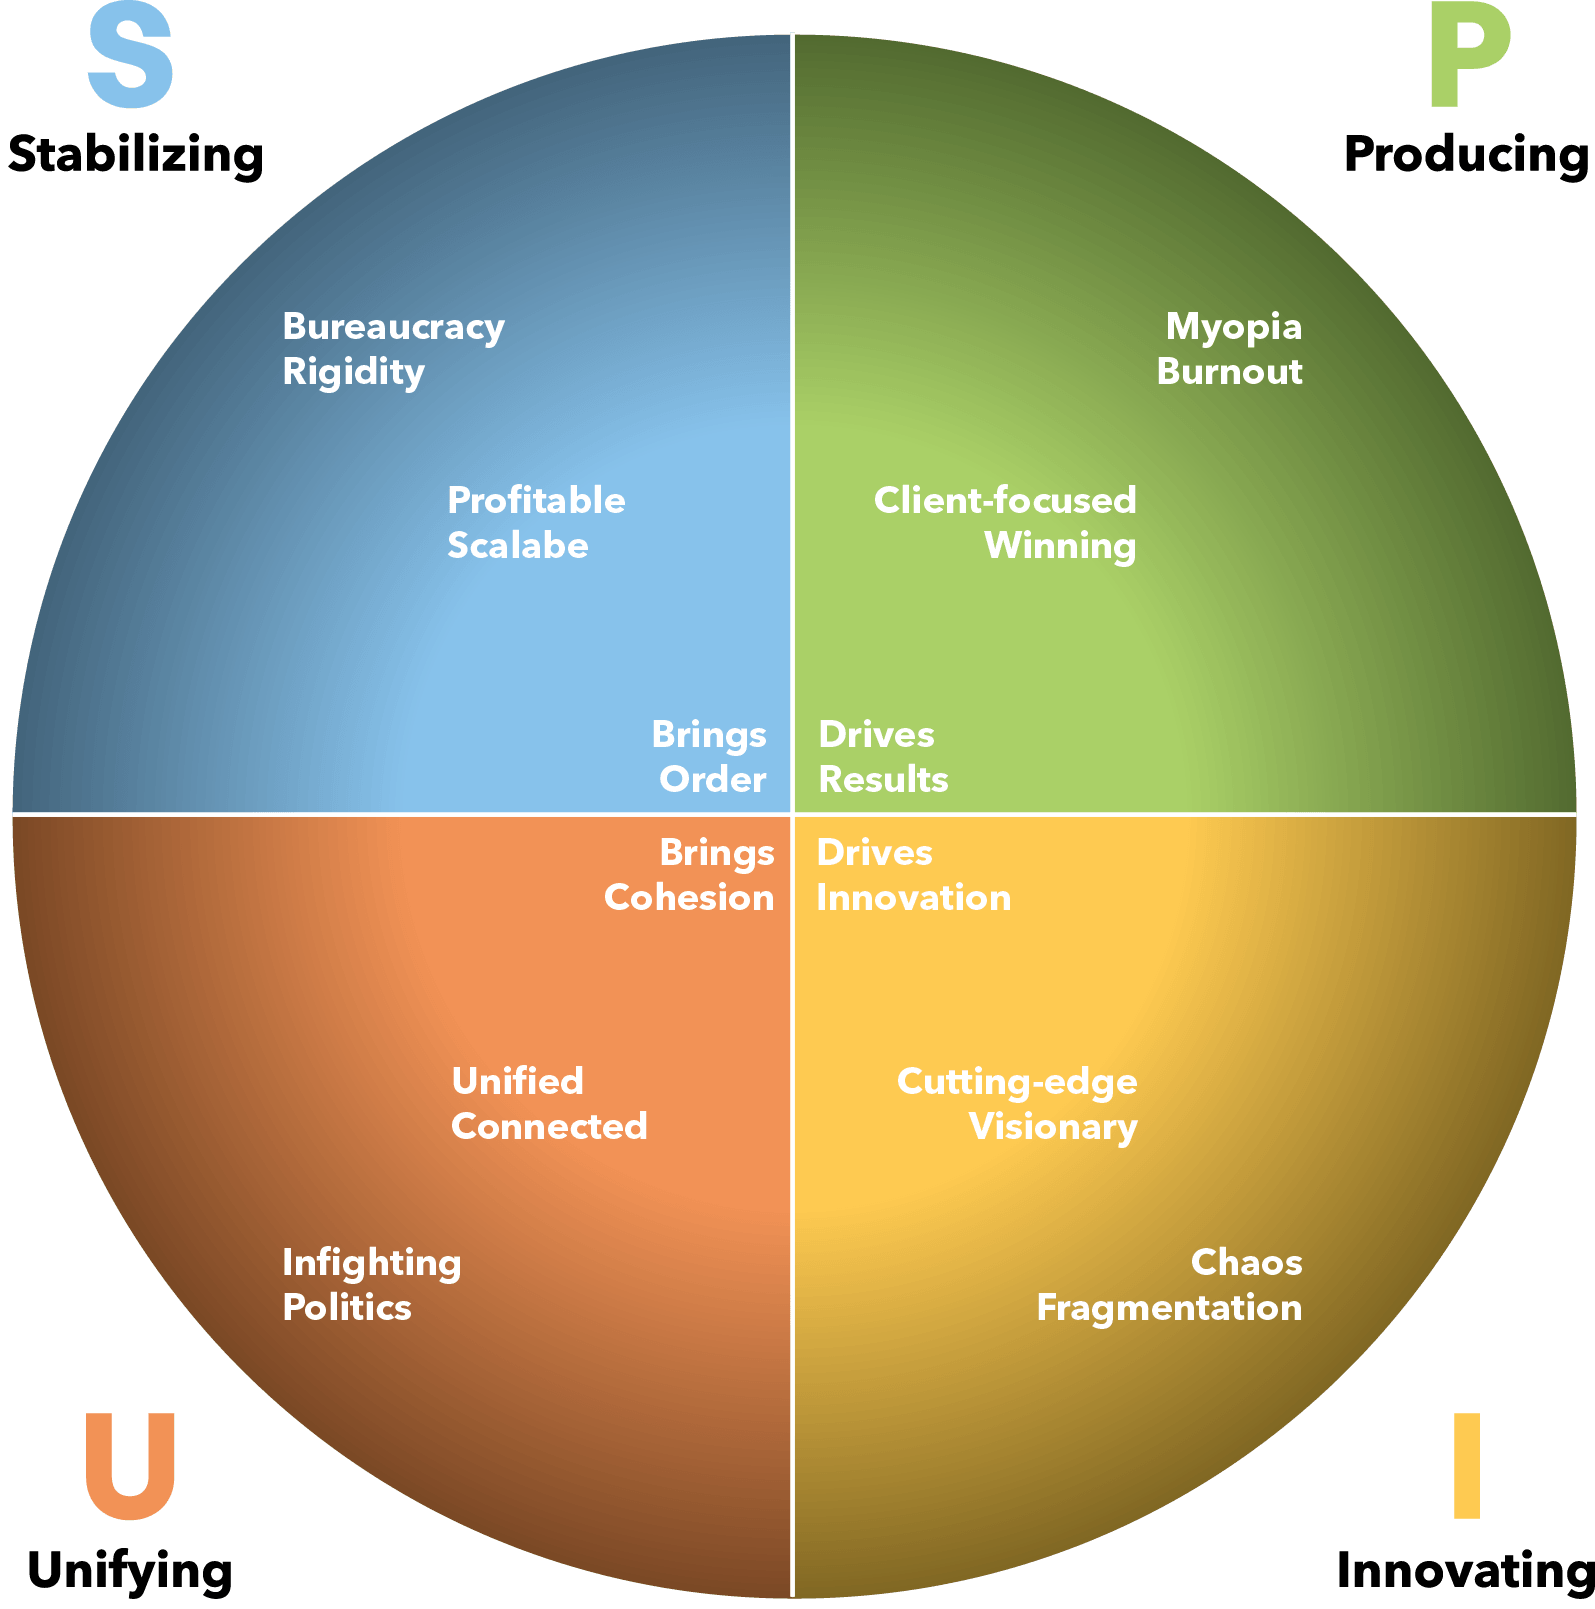
| Figure 9. The Producing, Stabilizing, Innovating, Unifying (PSIU) forces. |
 |
| Figure 10. From forces to styles. |
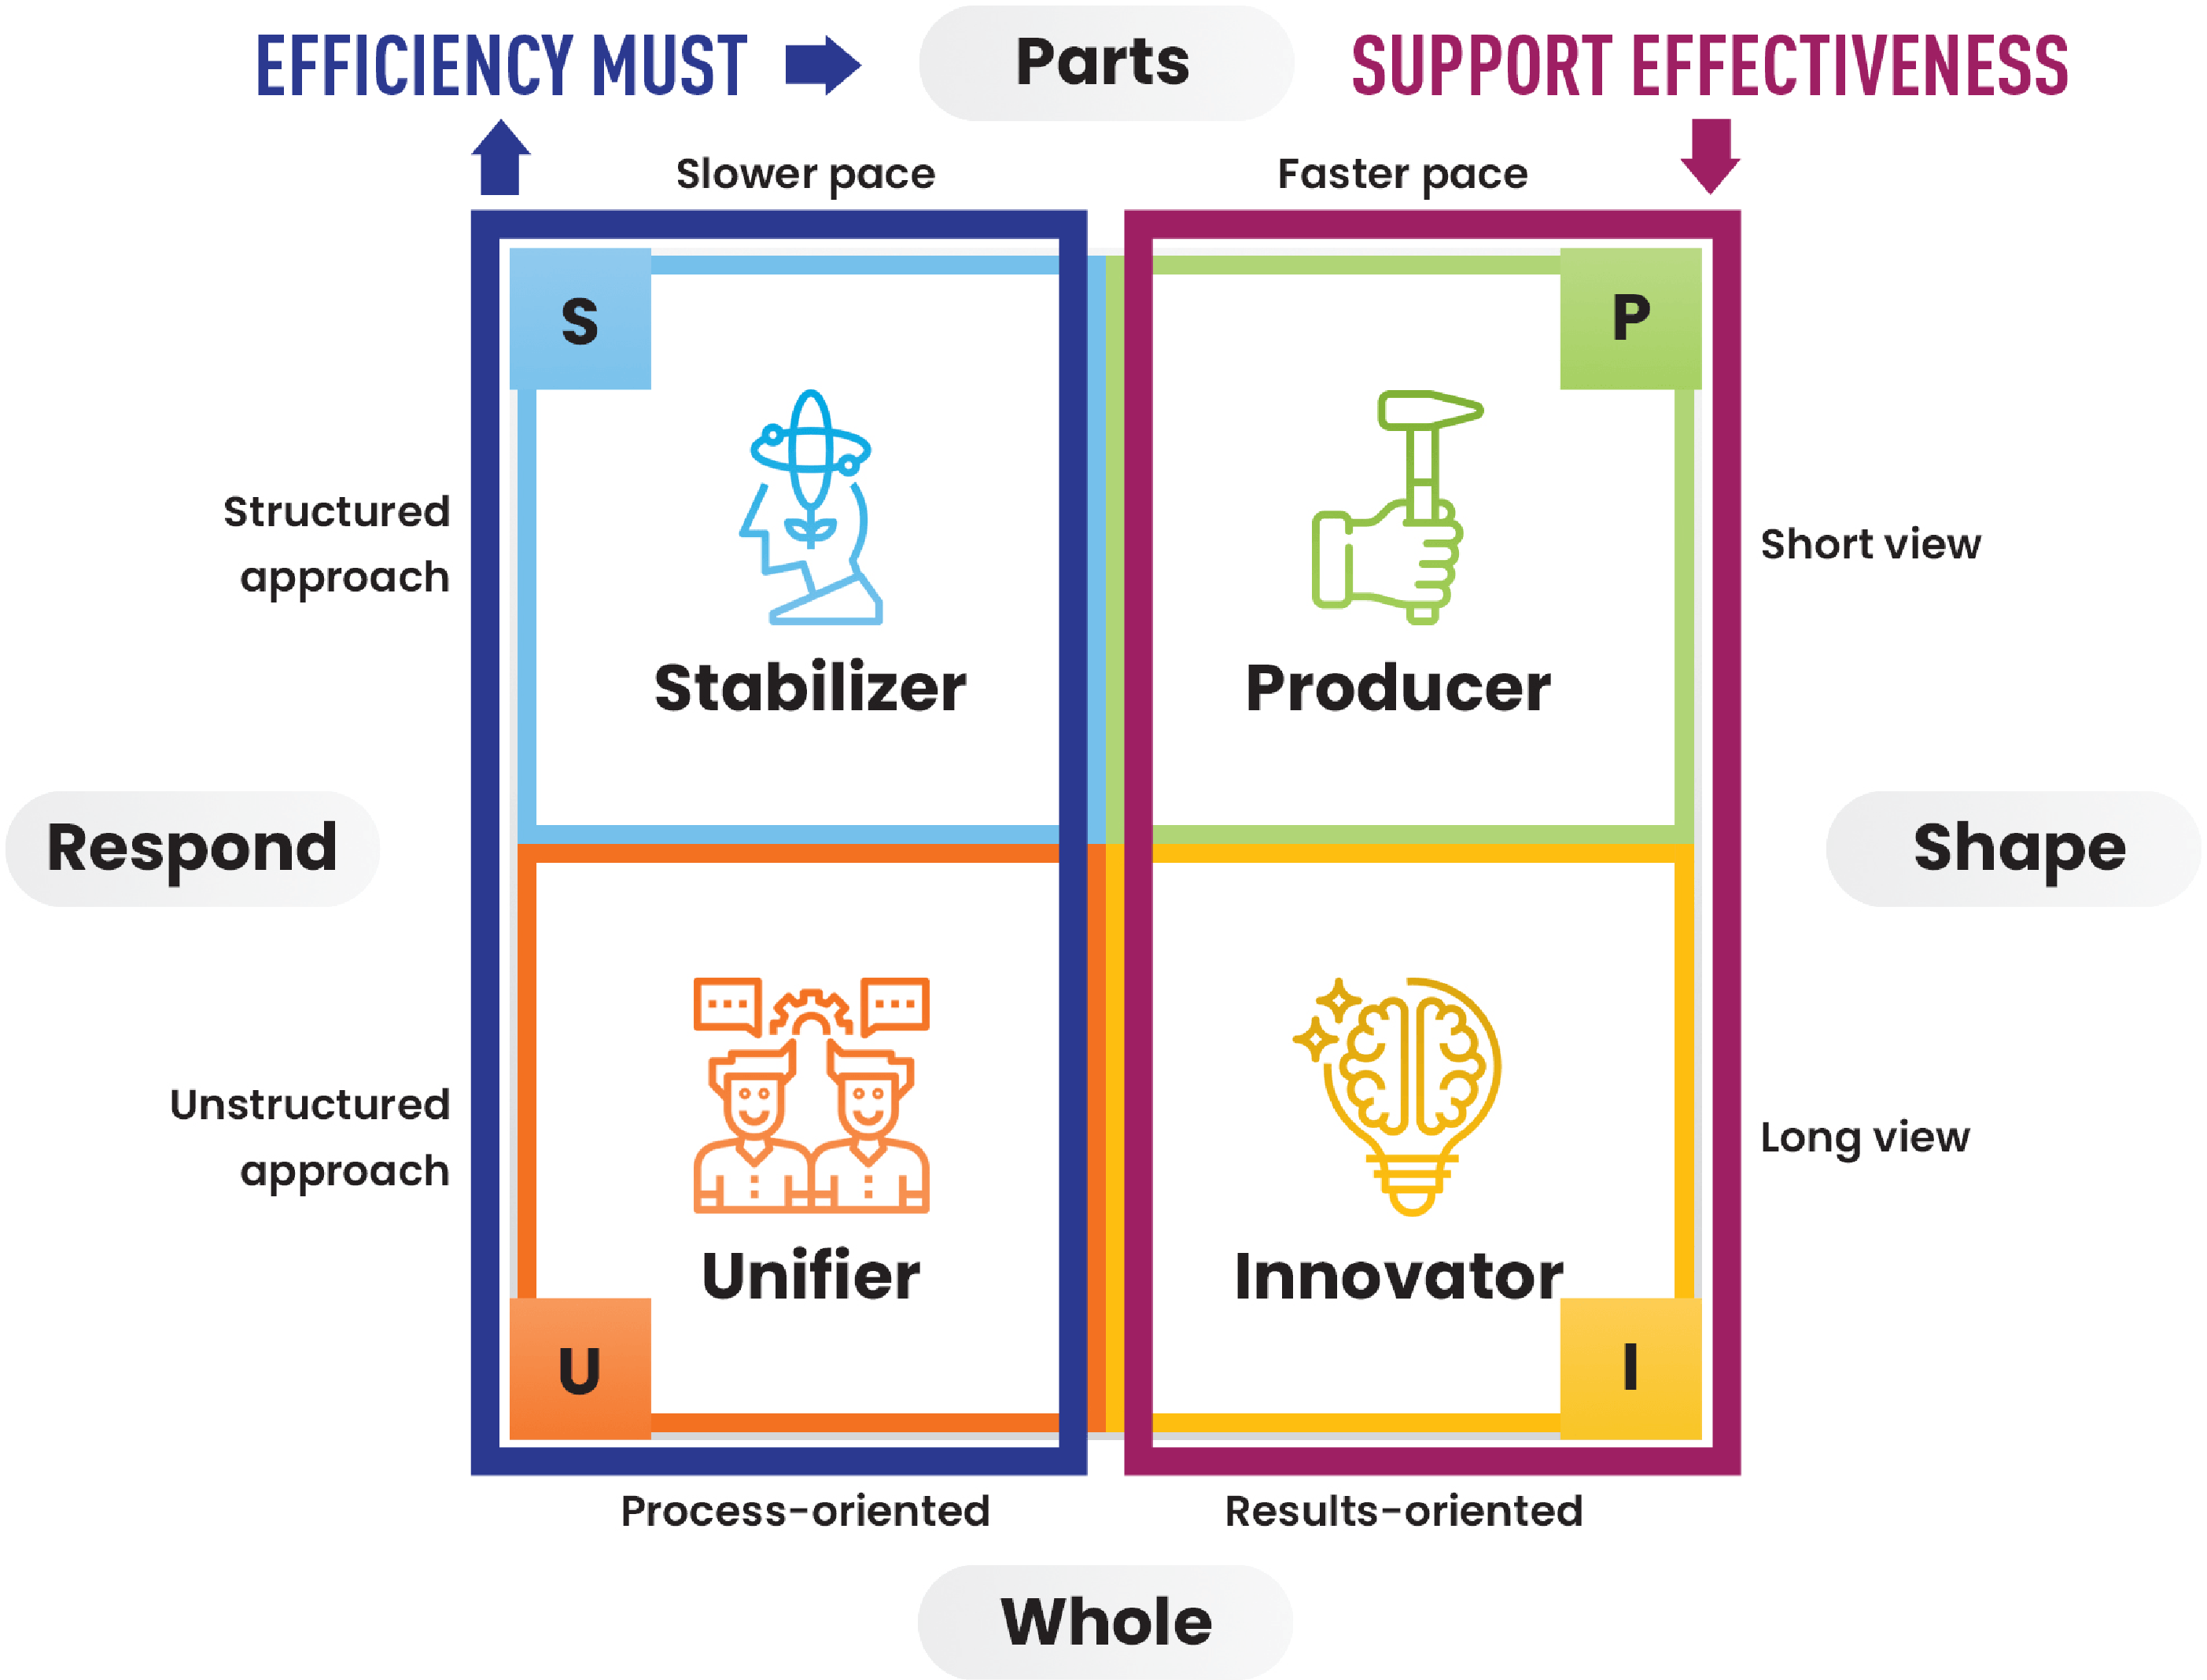 |
| Figure 11. PSIU: The left side must support the right side. |
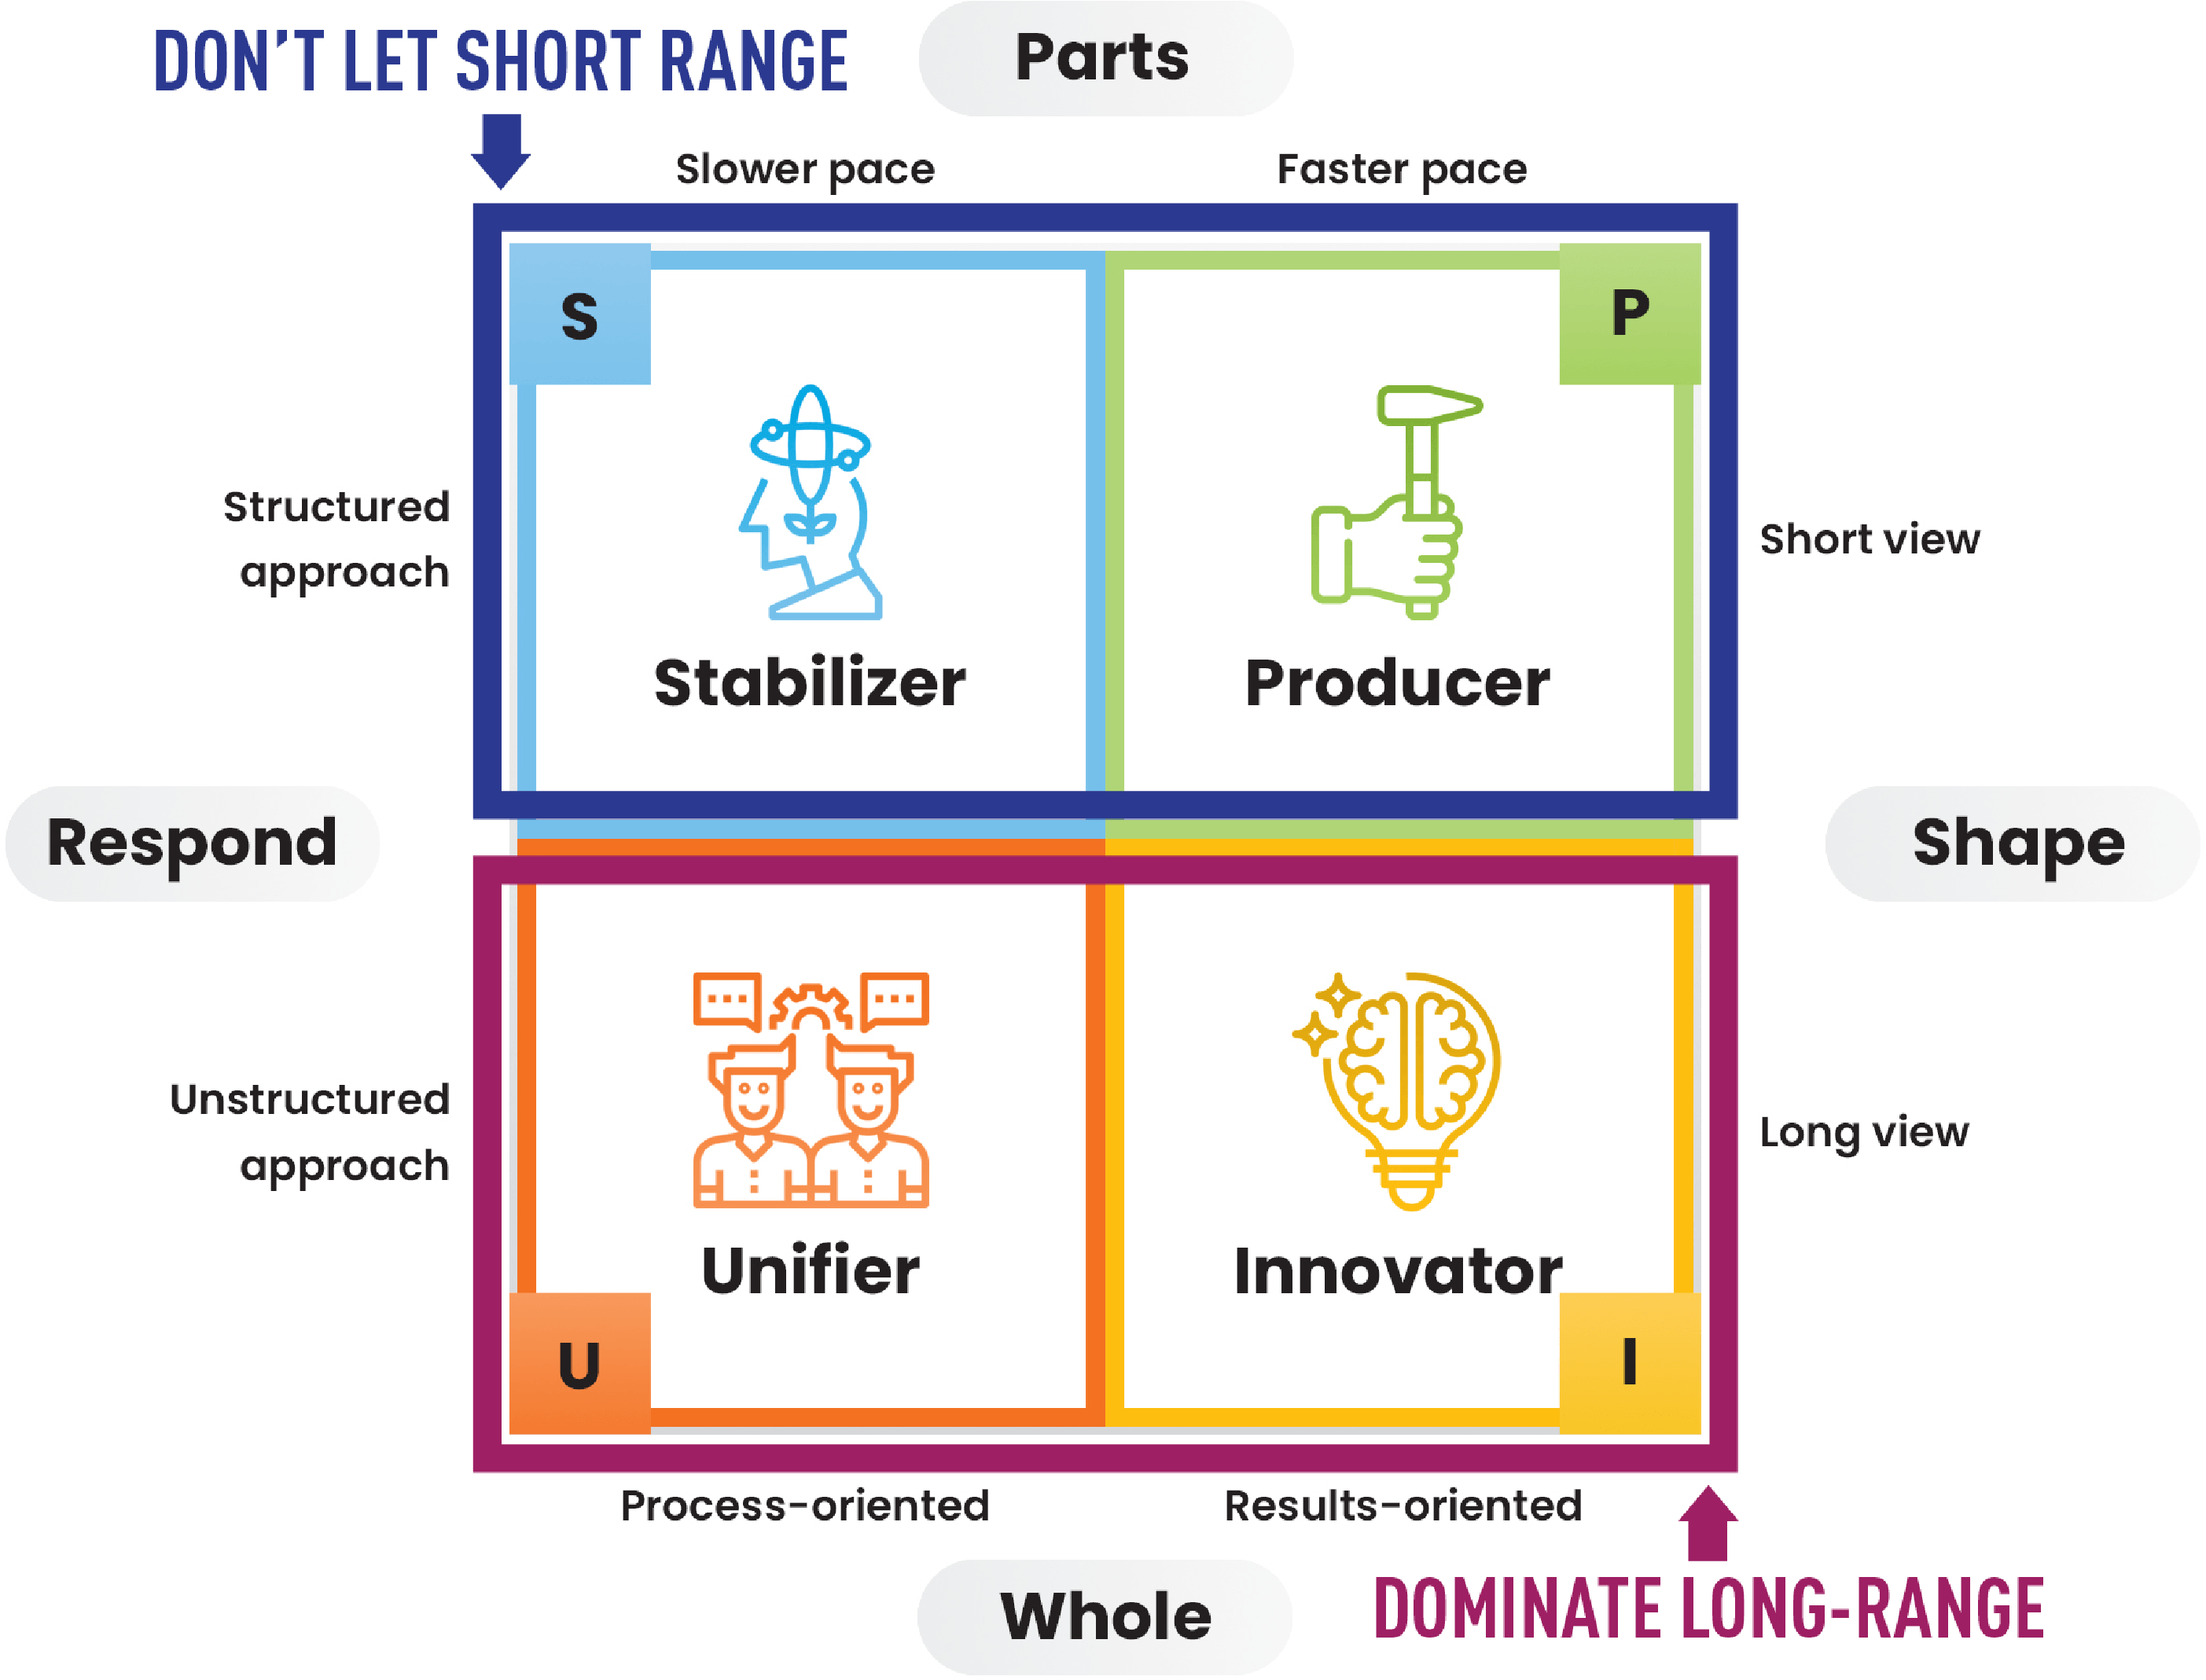 |
| Figure 12. PSIU: Don’t let short-range (PS) dominate long-range (IU). |
 |
| Figure 13. PSIU is advanced polarity management. |
Chapter 6 |
 |
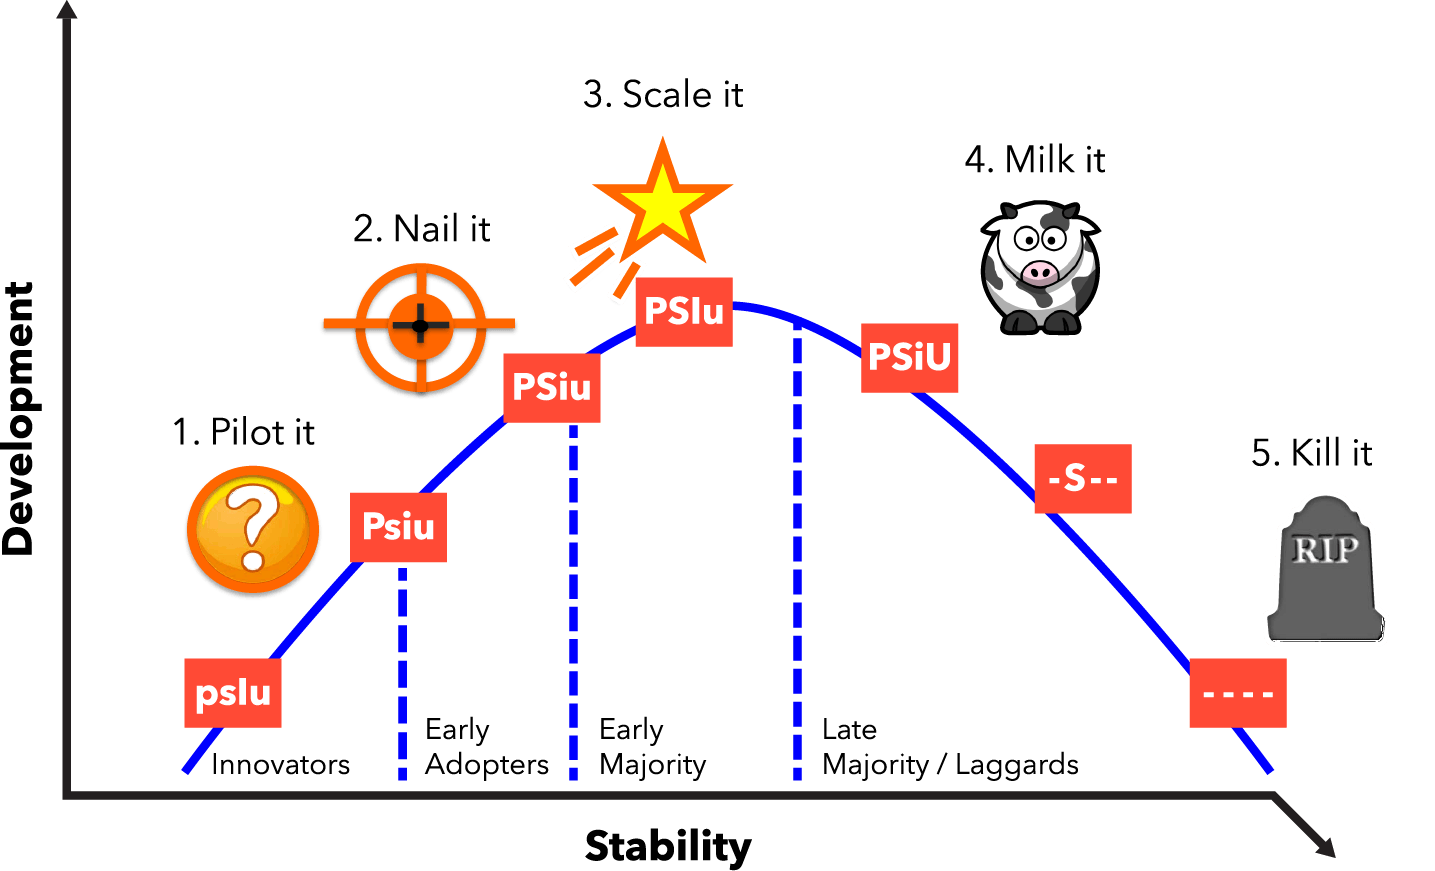
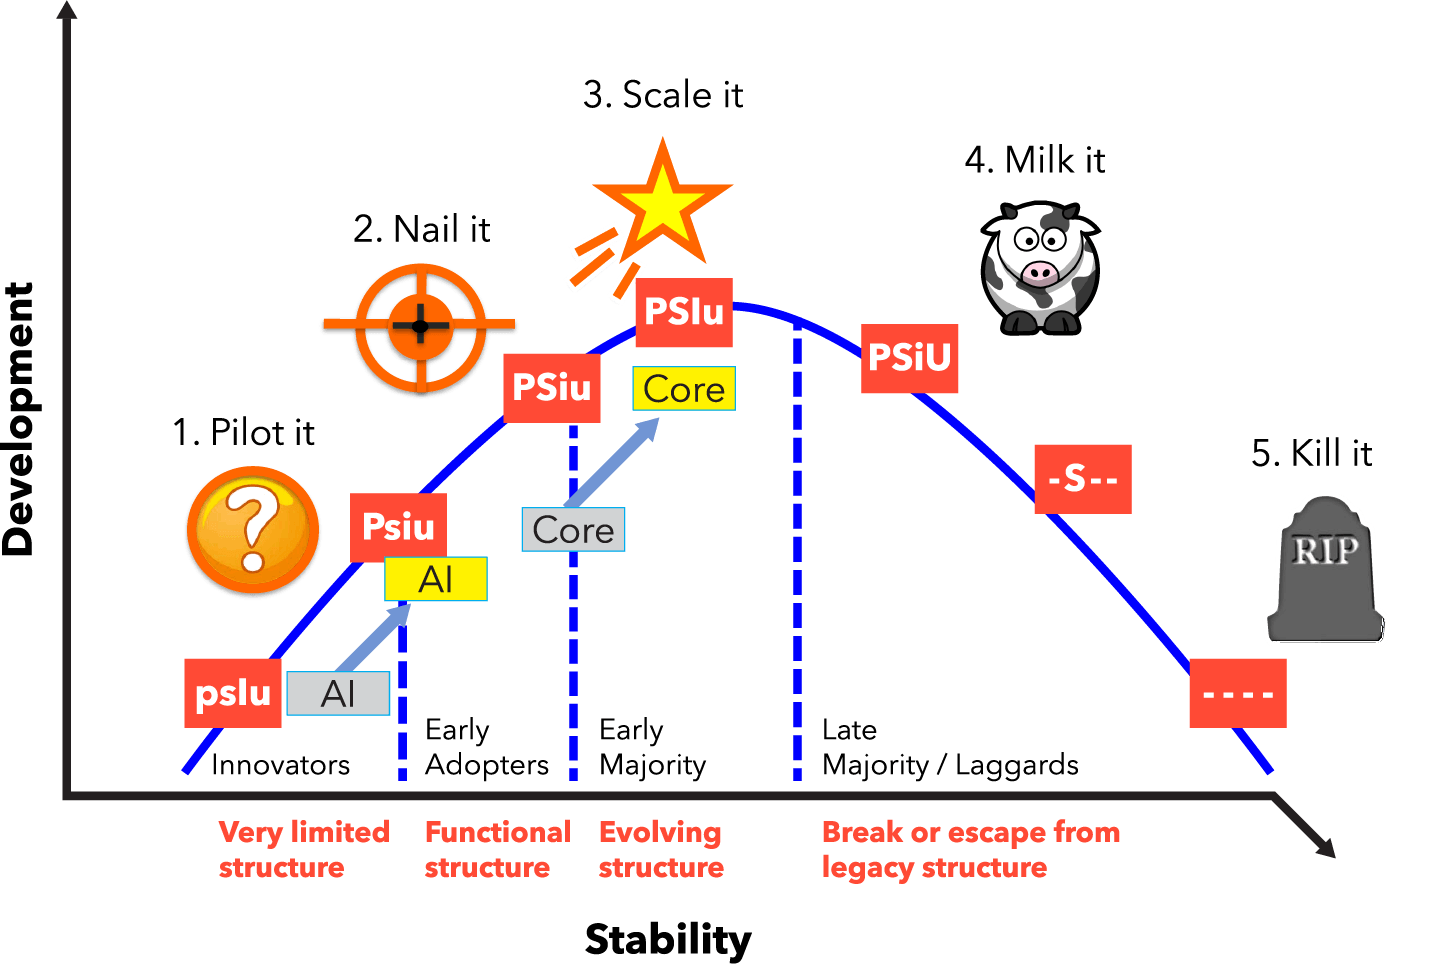
| Figure 14. Lifecycle strategy: Everything follows a lifecycle curve. |
 |
| Figure 15. Lifecycle strategy: The Organizational Physics Strategy Map. |
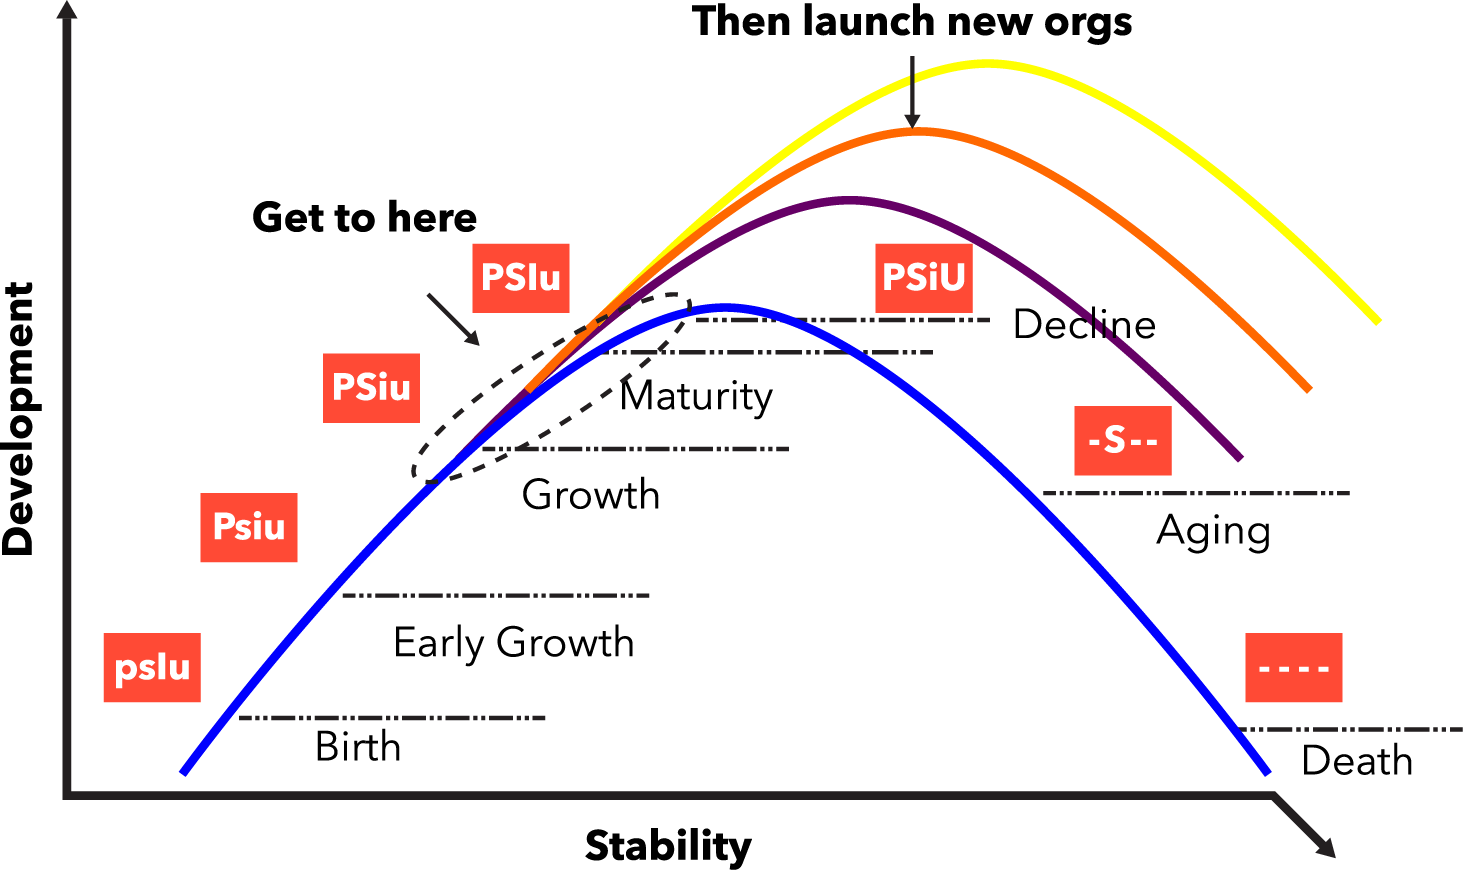 |
| Figure 16. Lifecycle strategy: The goal is perpetual renewal. |
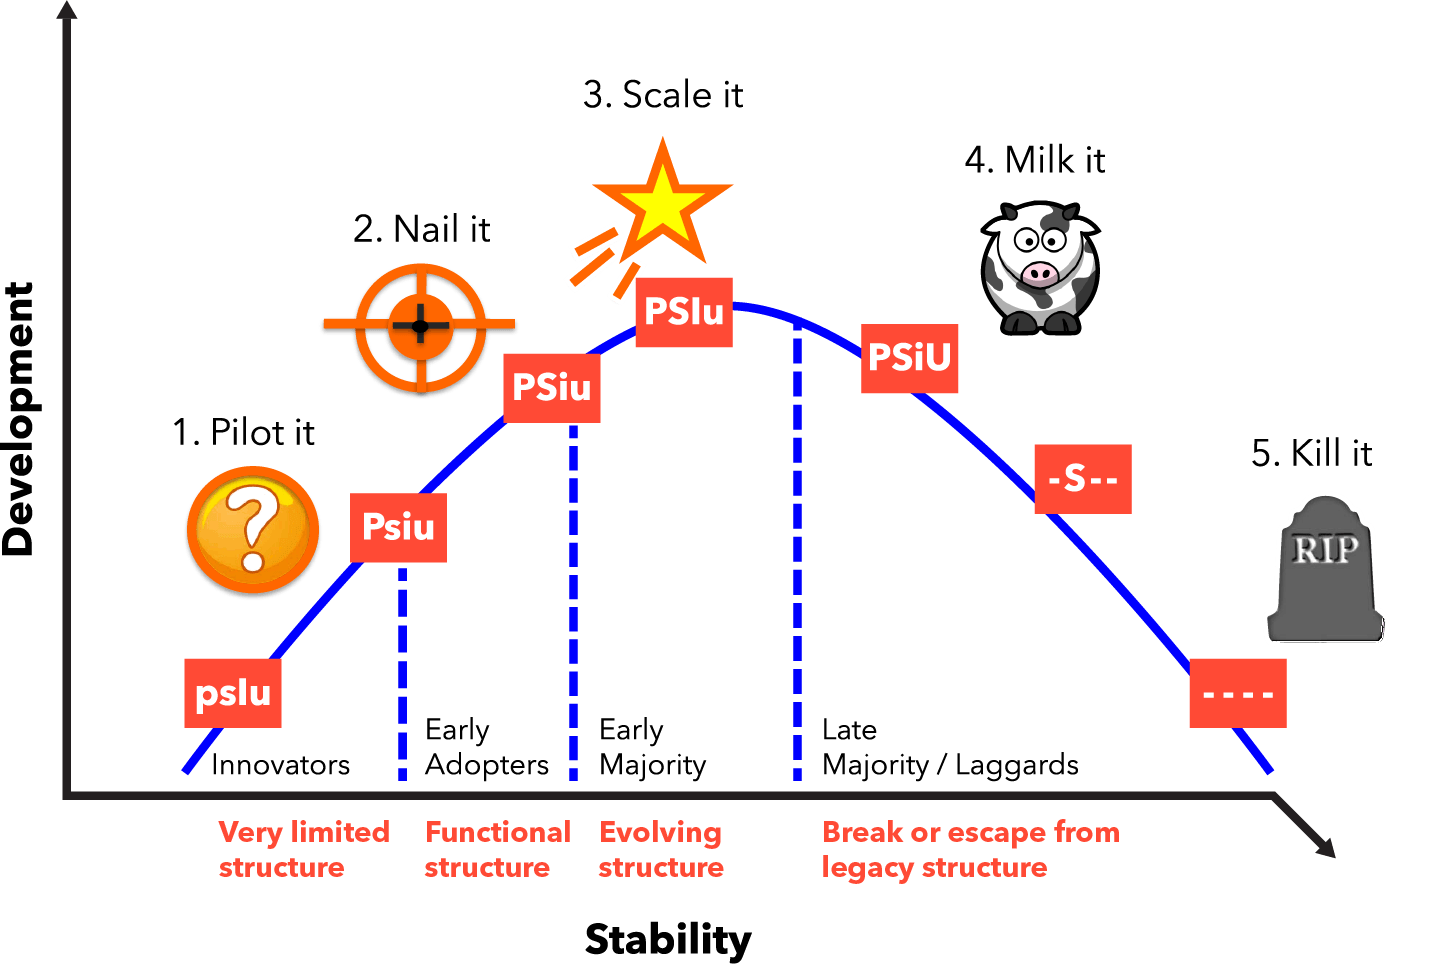 |
| Figure 17. Lifecycle strategy: Different lifecycle stages require different structures. |
 |
| Figure 18. Lifecycle strategy: Strategy Map showing where the two PeoplePower business units are currently in their development. |
 |
| Figure 19. Lifecycle strategy: Strategy Map showing where PeoplePower needs to drive to next in sequence. |
Chapter 7 |
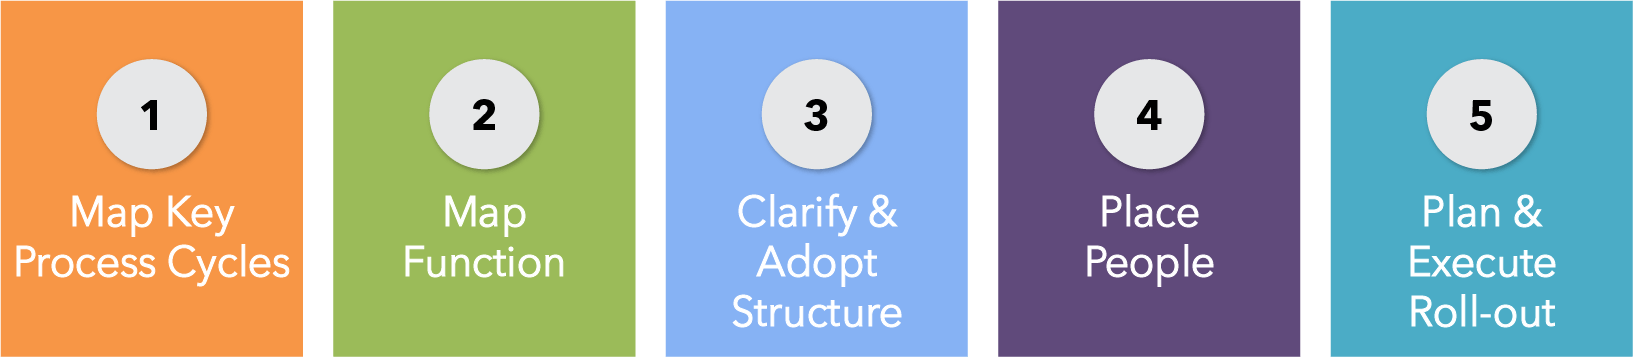 |
| Figure 20. The five steps to design a new structure quickly and correctly. |
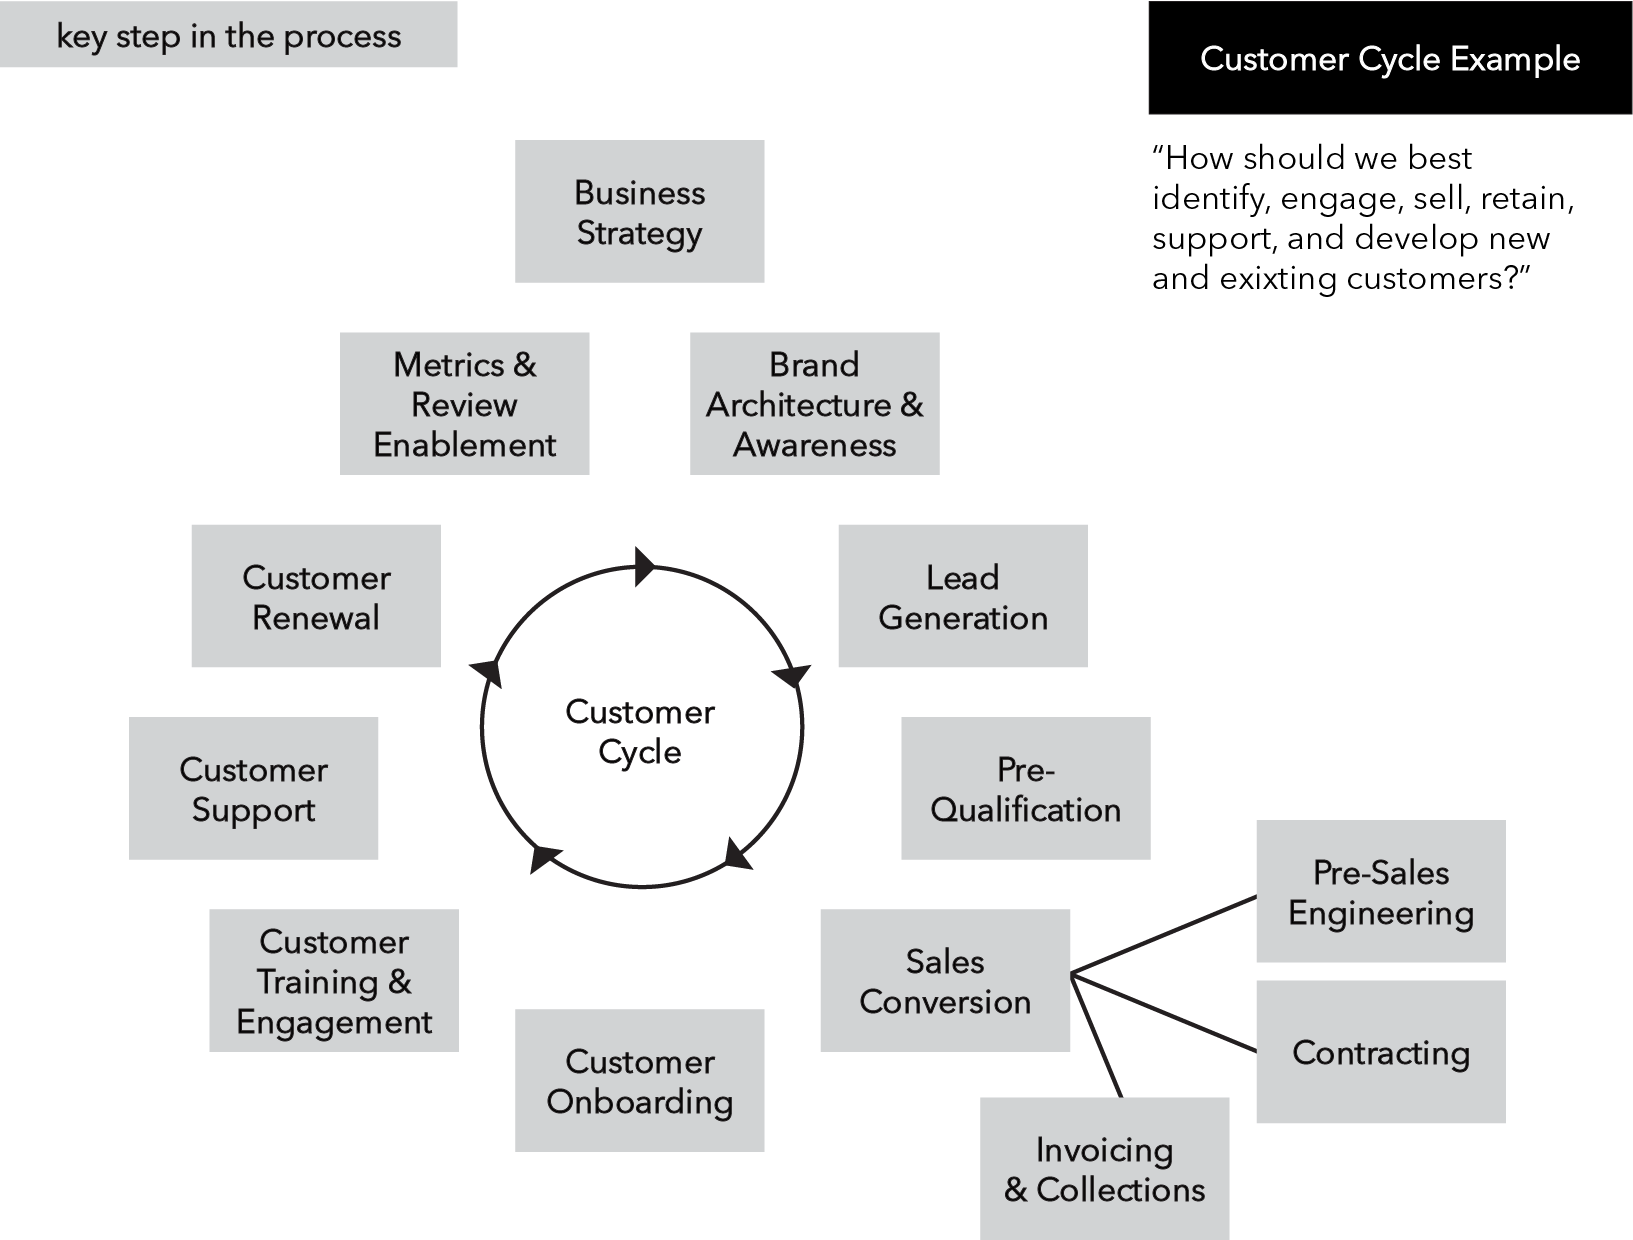 |
| Figure 21. Customer Cycle for PeoplePower. |
 |
| Figure 22. Product Development Cycle for PeoplePower. |
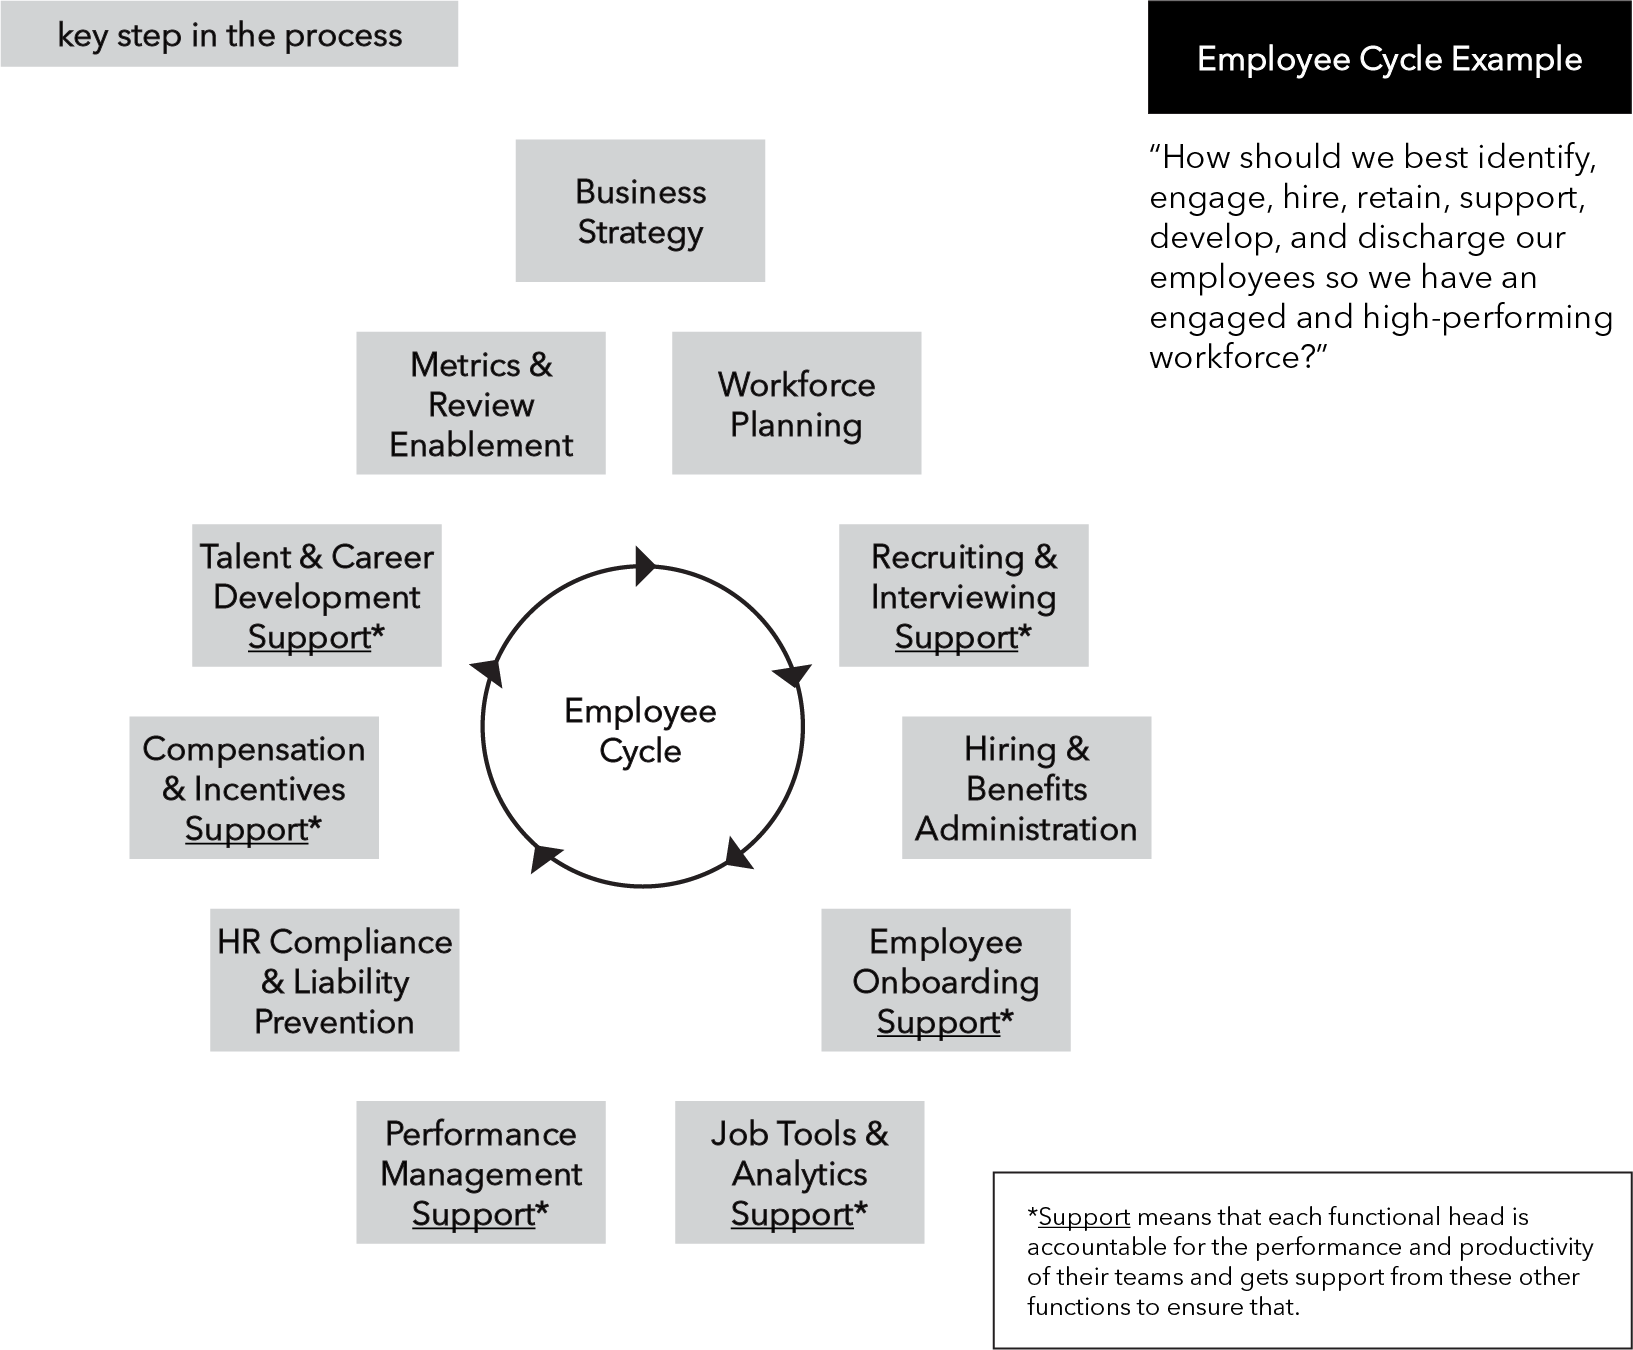 |
| Figure 23. Employee Cycle for PeoplePower. |
Chapter 8 |
 |
| Figure 24. Blank Structure Map. |
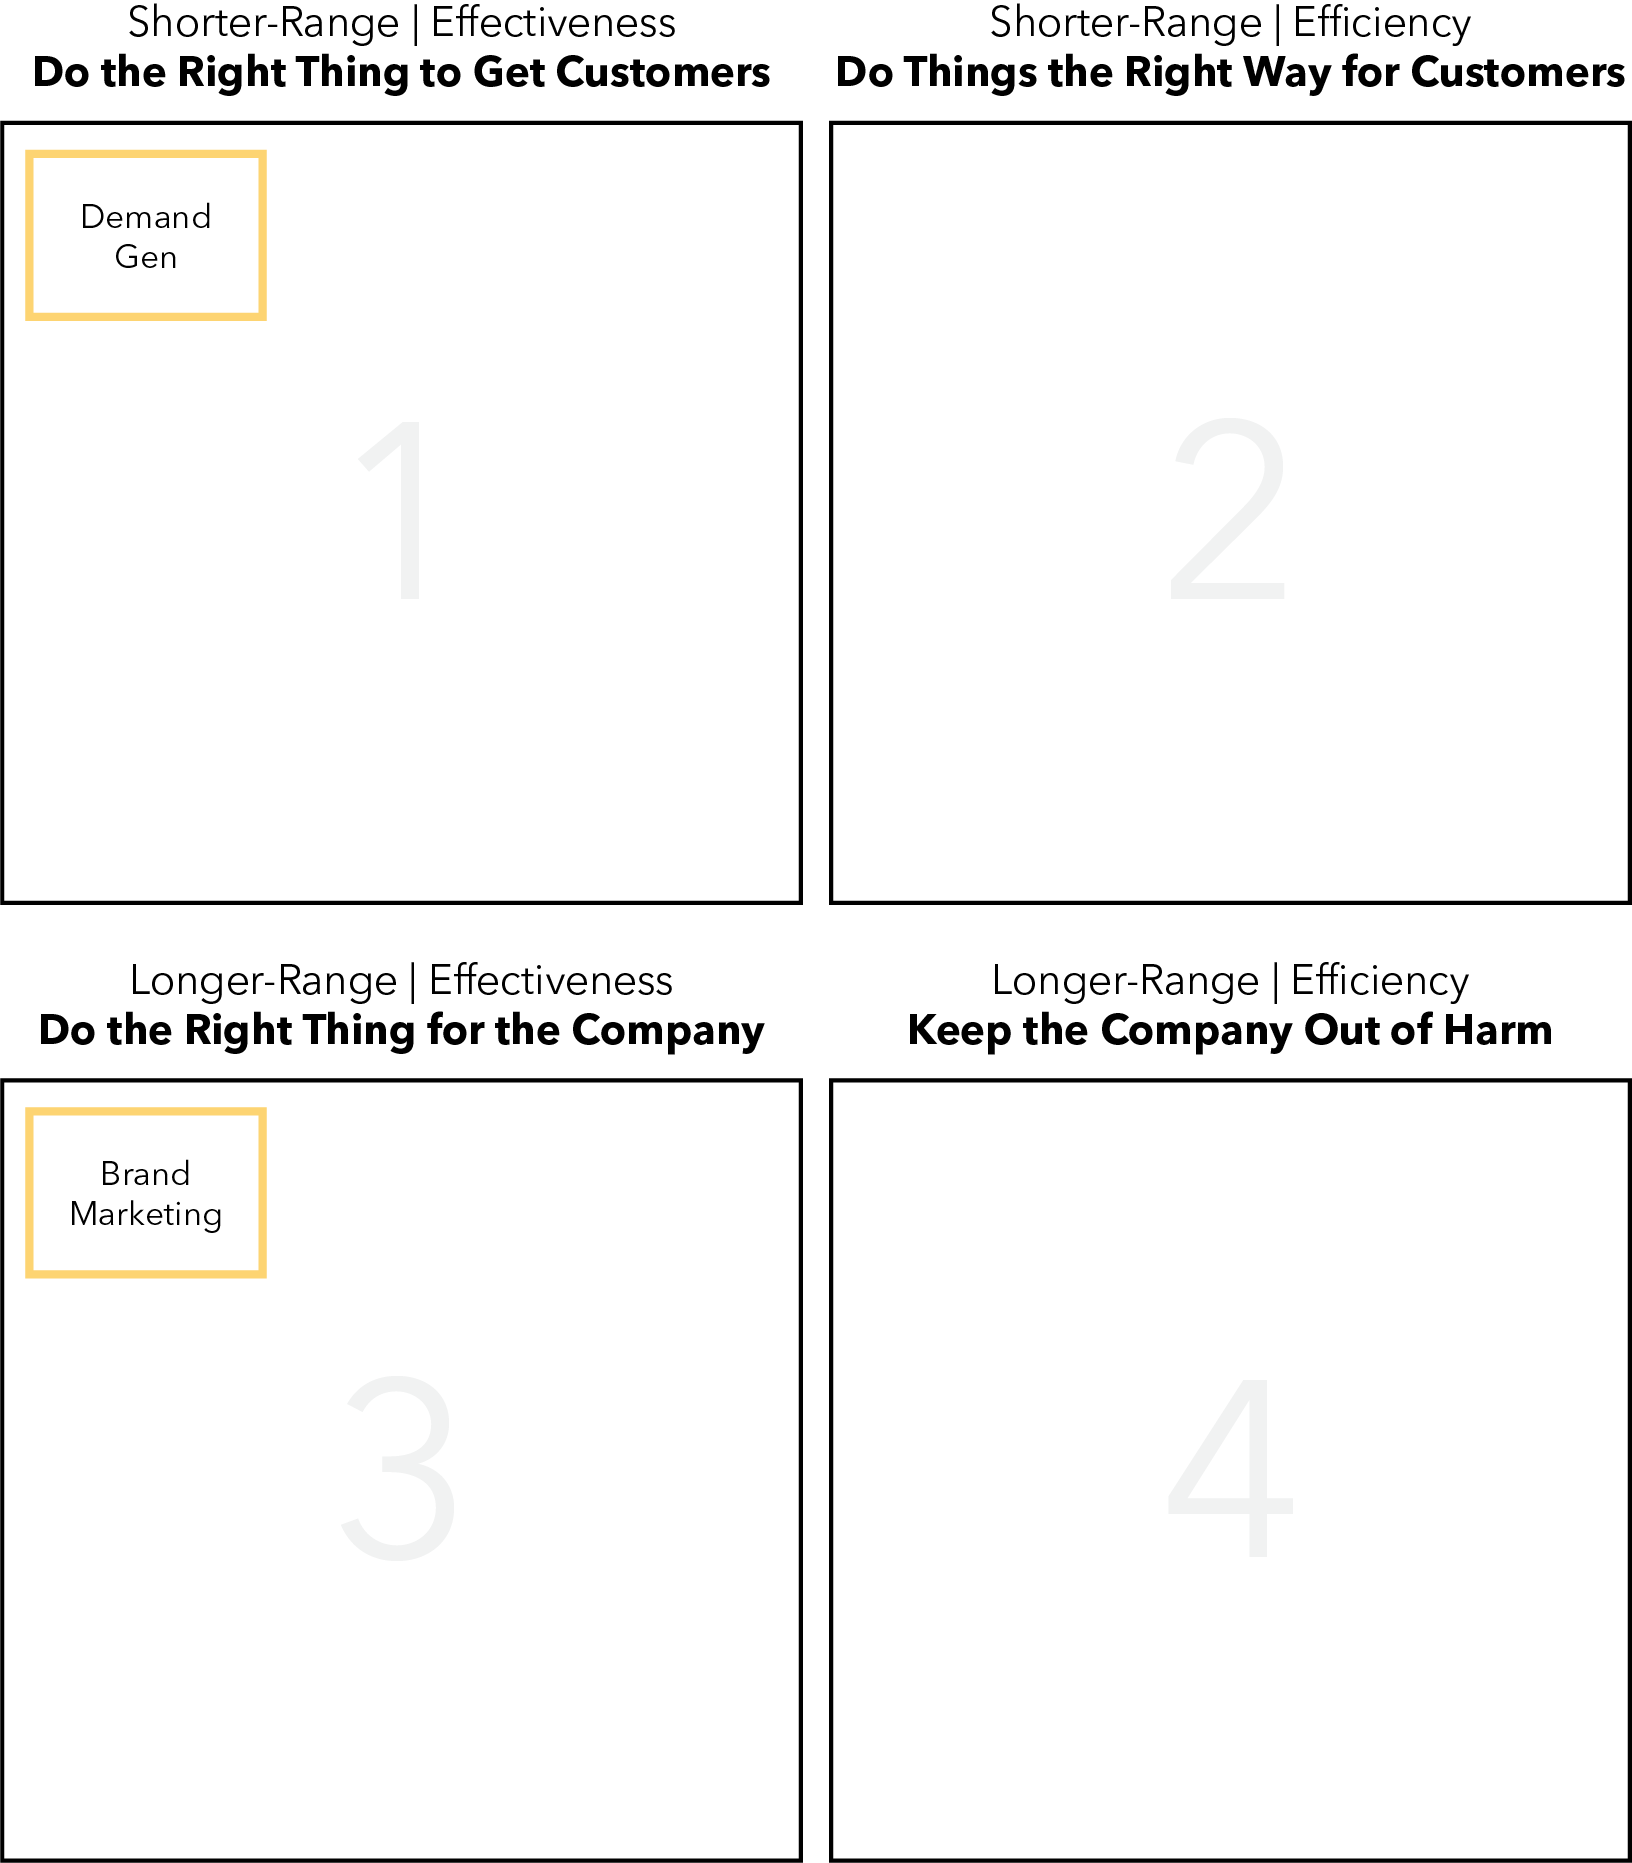 |
| Figure 25. PeoplePower Structure Map with Brand Marketing and Demand Generation. |
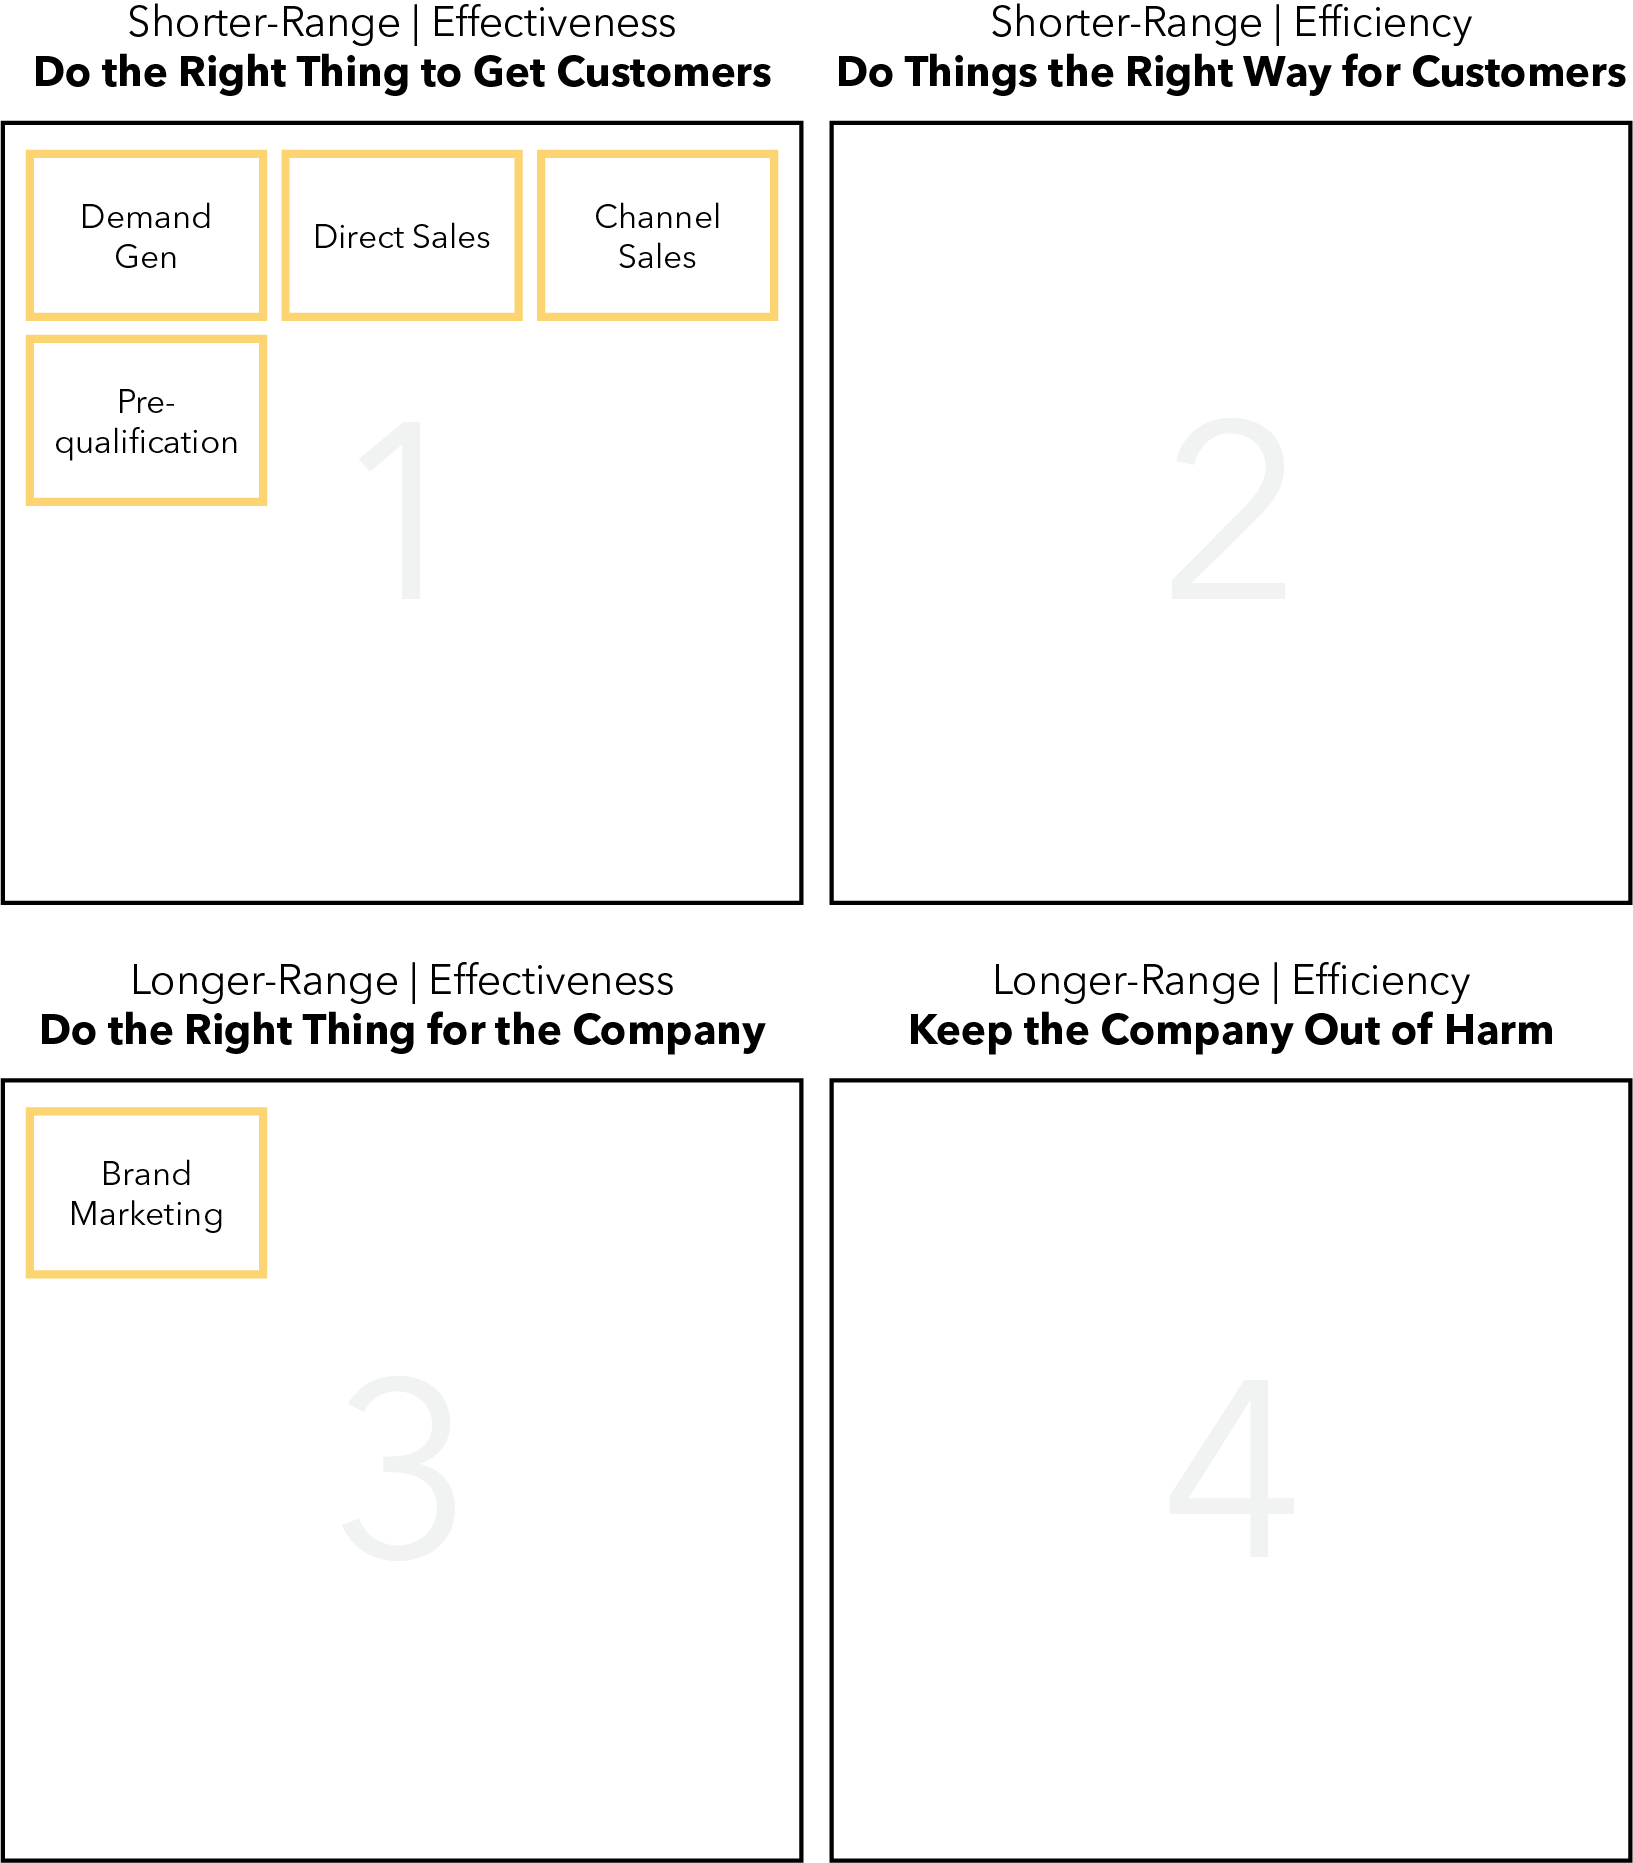 |
| Figure 26. PeoplePower Structure Map adding Pre-qualification, Direct Sales, and Channel Sales. |
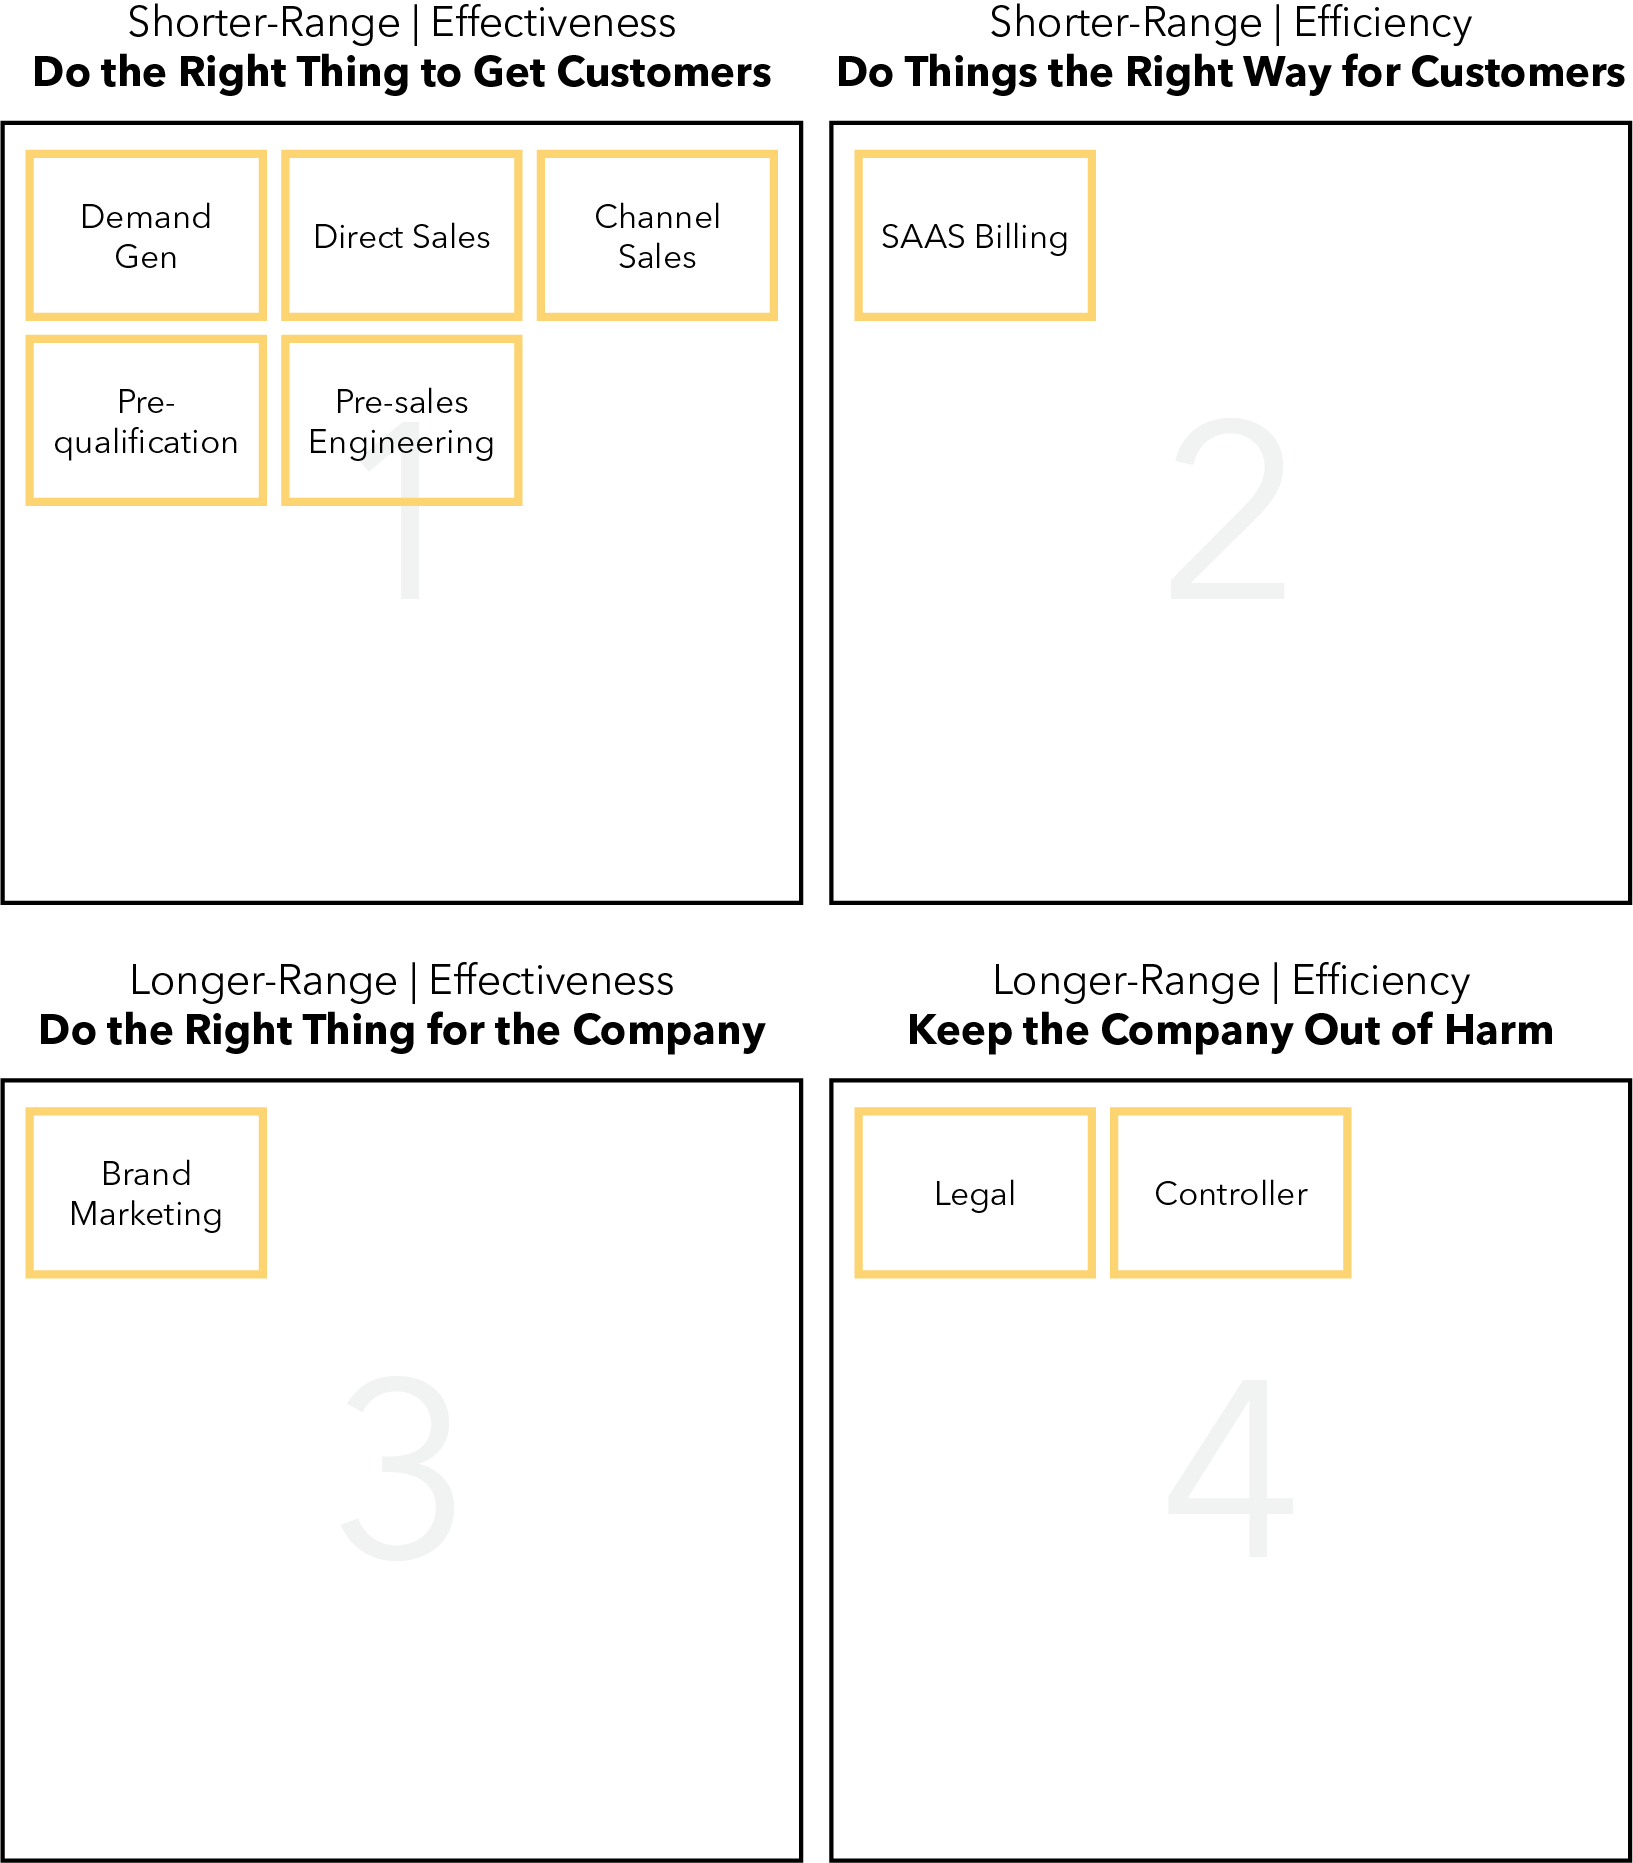 |
| Figure 27. PeoplePower Structure Map adding Pre-Sales Engineering, SAAS Billing, Legal, and Controller. |
 |
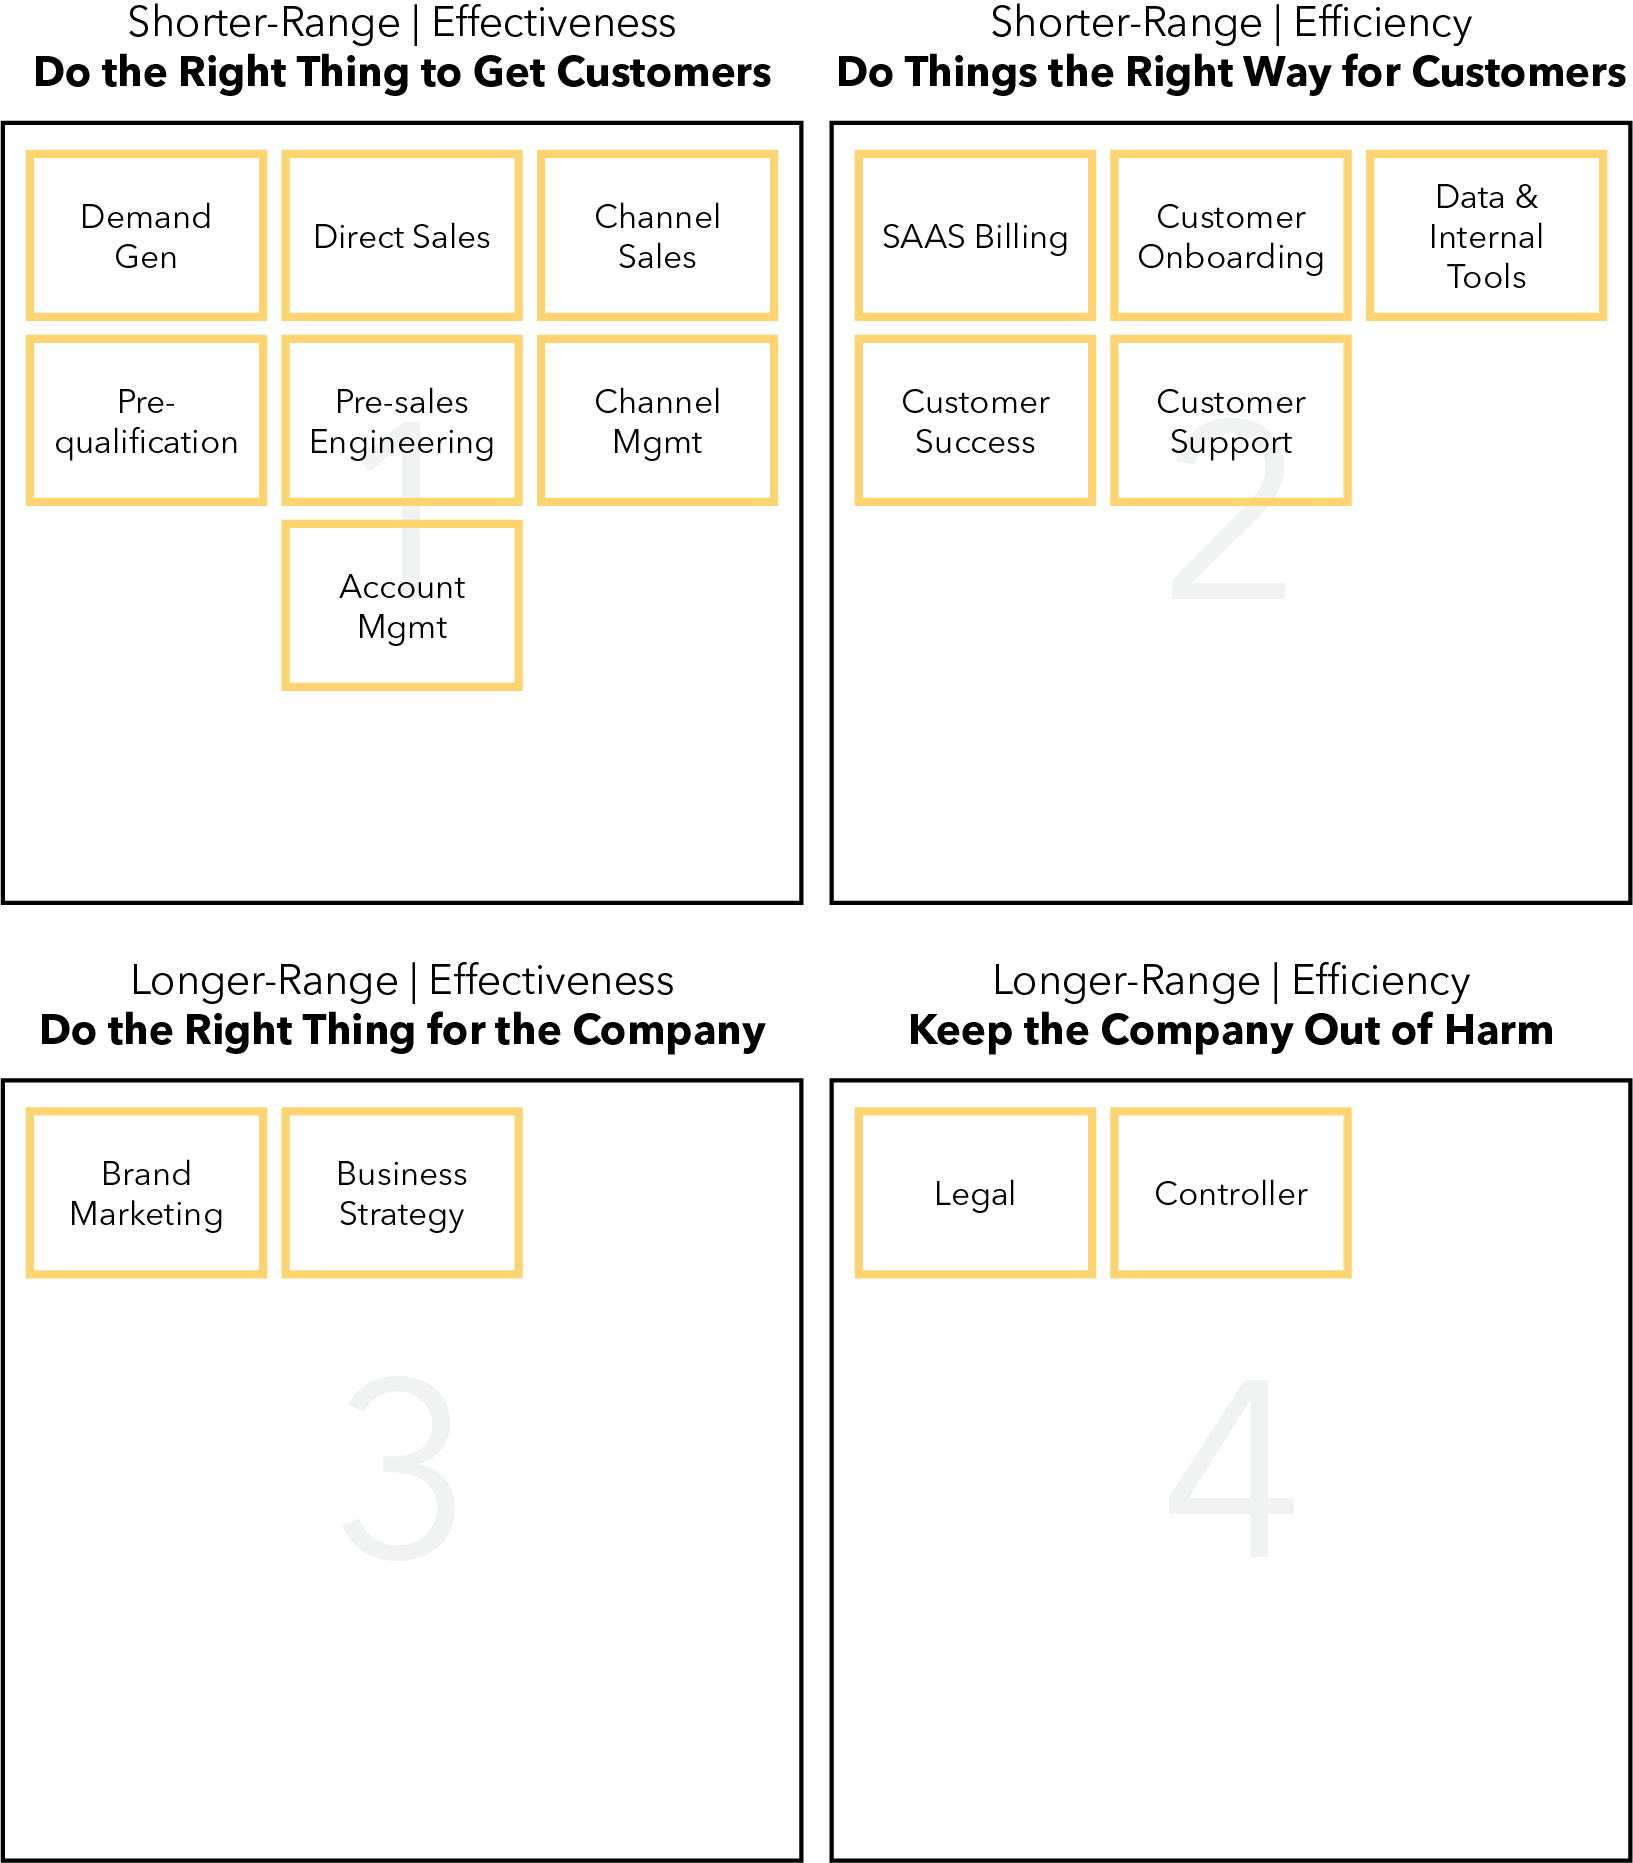
| Figure 28. PeoplePower Structure Map adding Customer Onboarding, Customer Success, and Customer Support. |
 |
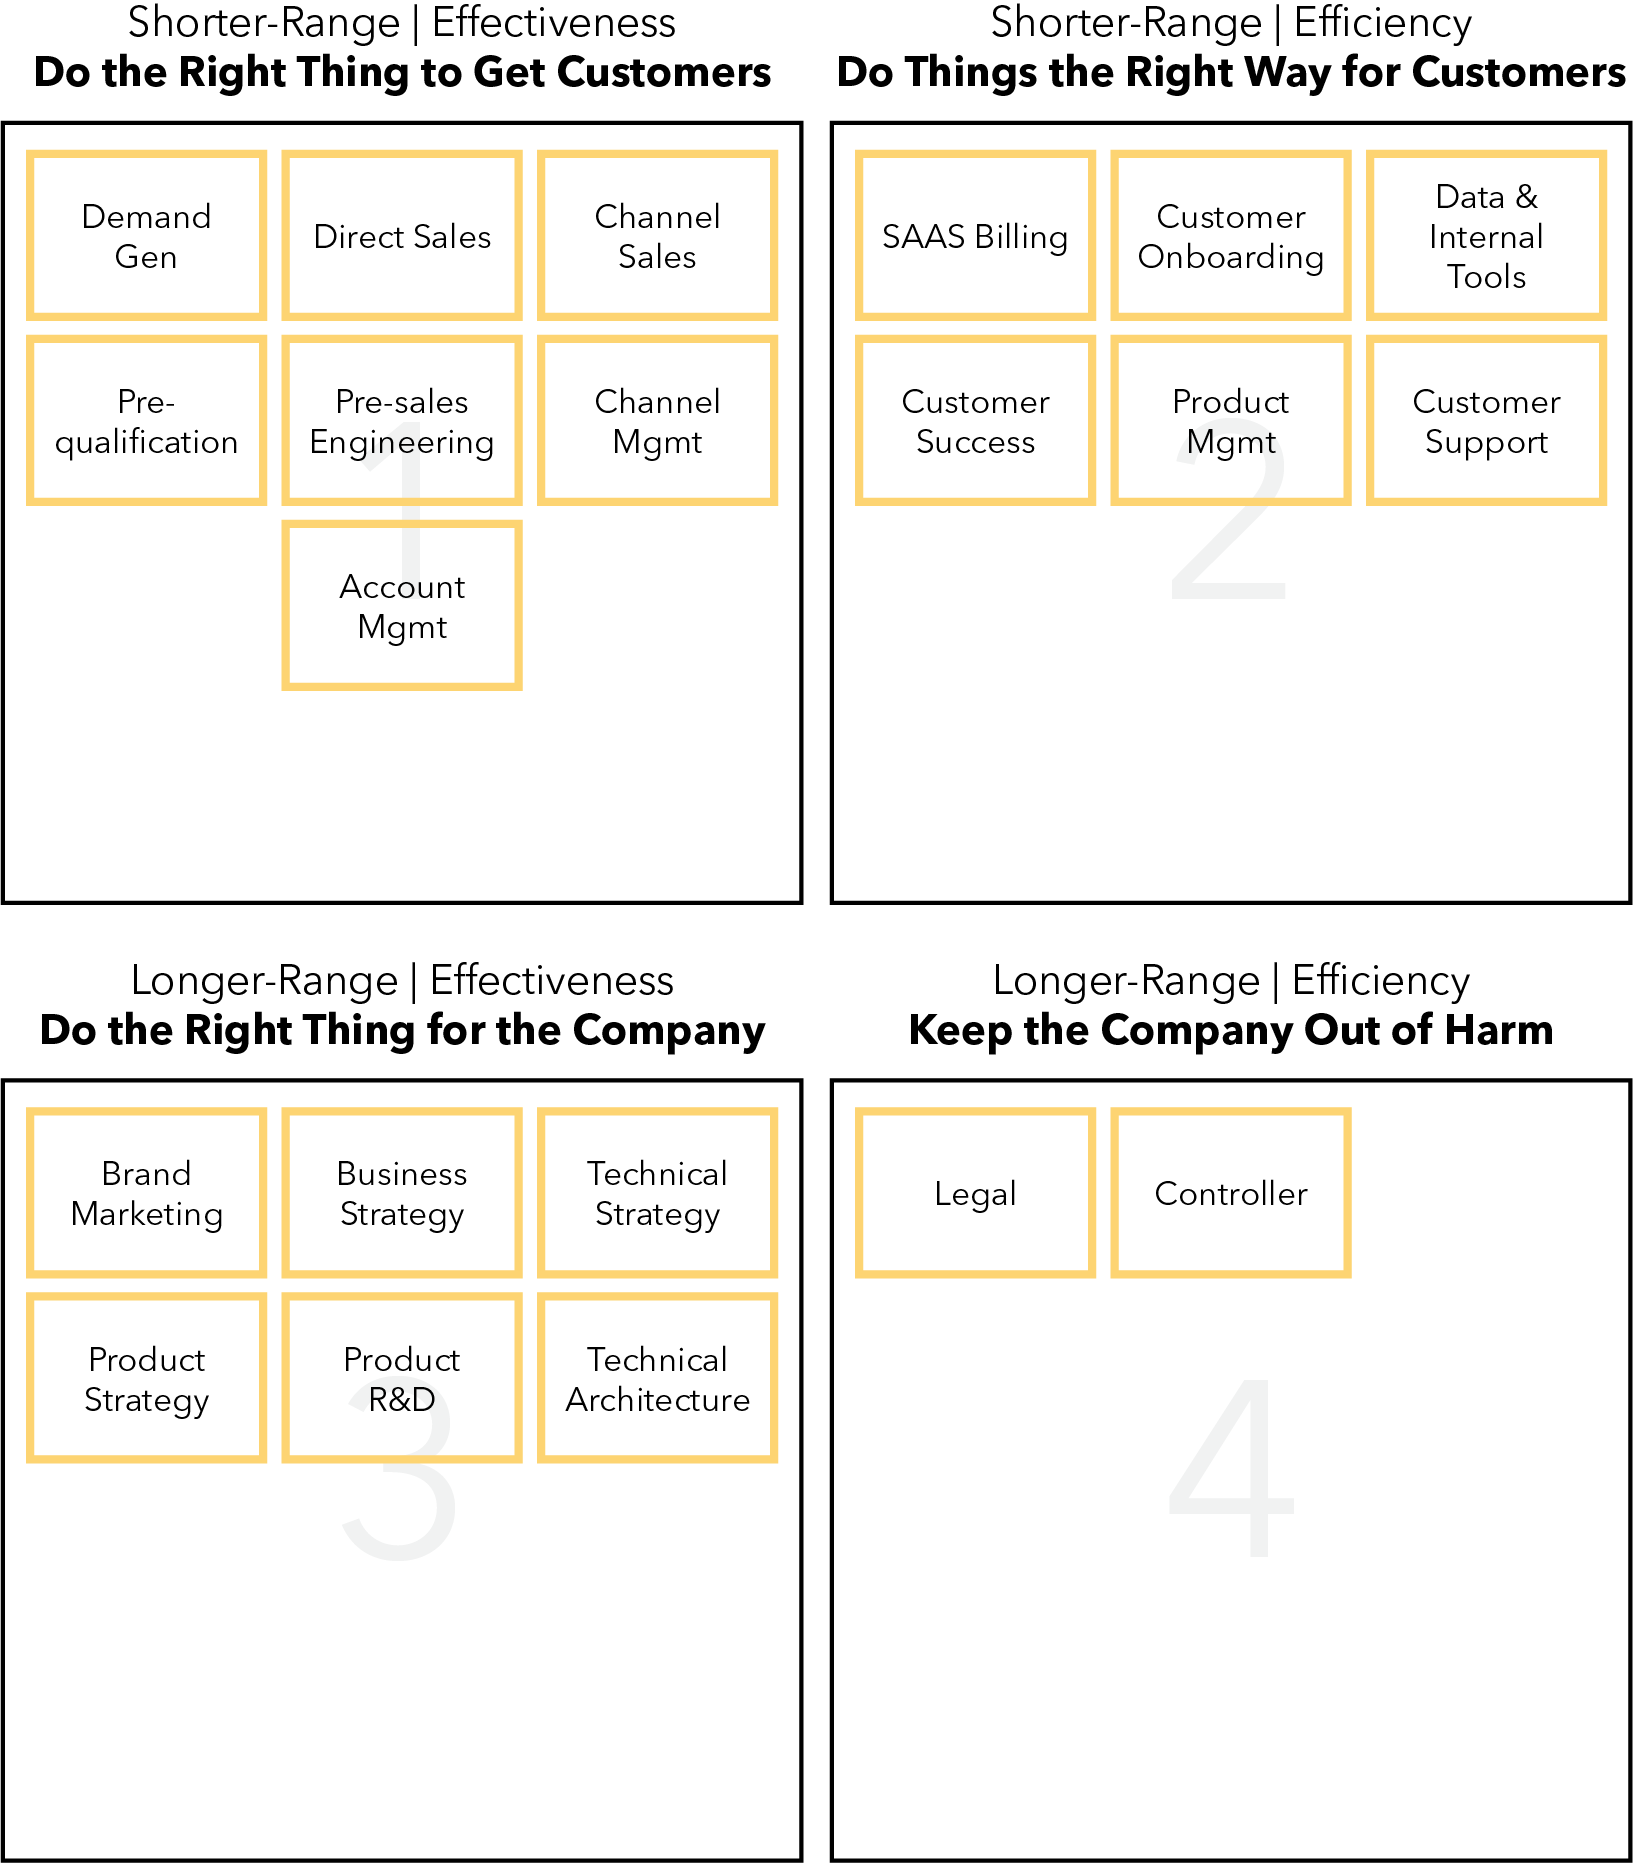
| Figure 29. PeoplePower Structure Map adding Data & Internal Tools, Account Management, Channel Management, and Business Strategy. |
 |
| Figure 30. PeoplePower Customer Cycle mapped with the functions accountable for each step in the cycle. |
 |
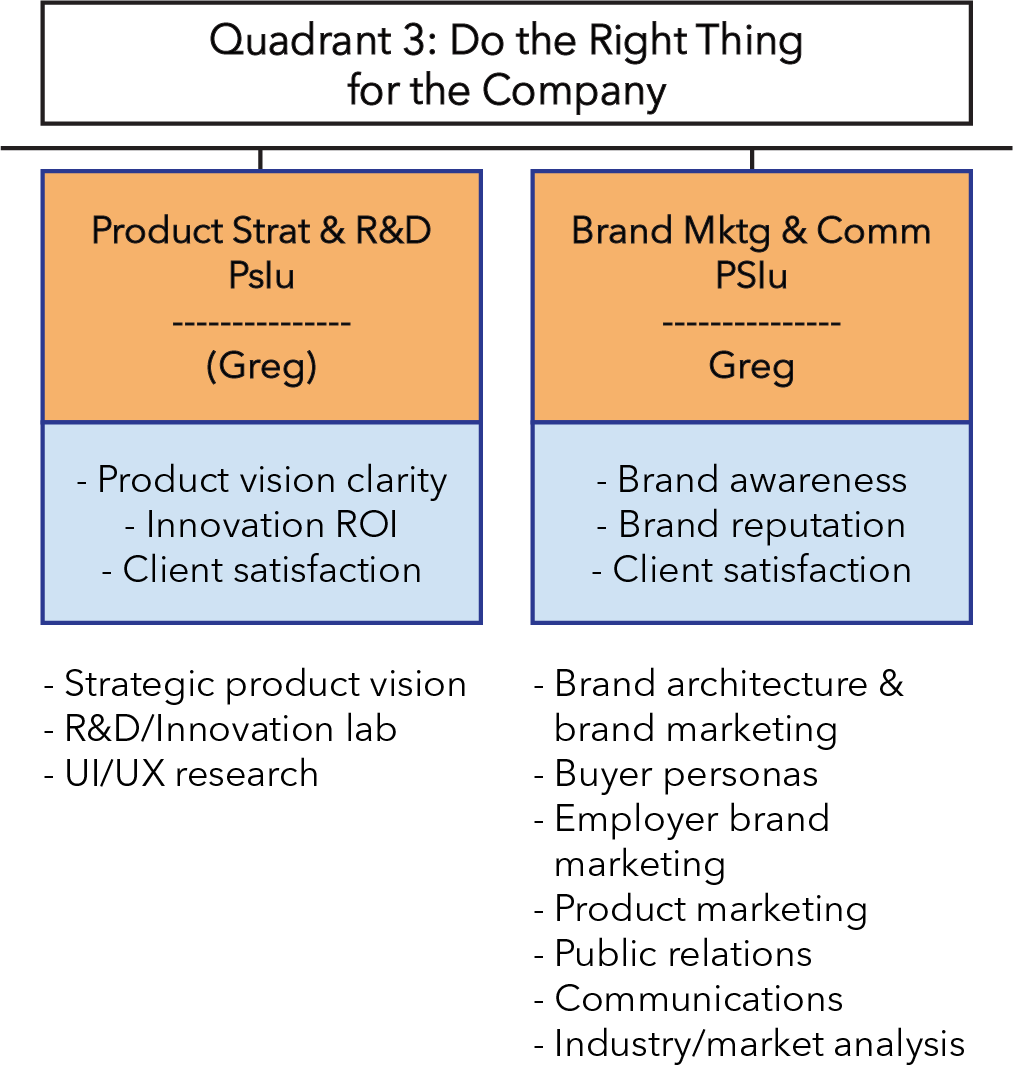
| Figure 31. PeoplePower Structure Map adding Product Strategy & R&D and Technical Strategy & Architecture to Quadrant 3 and Product Management to Quadrant 2. |
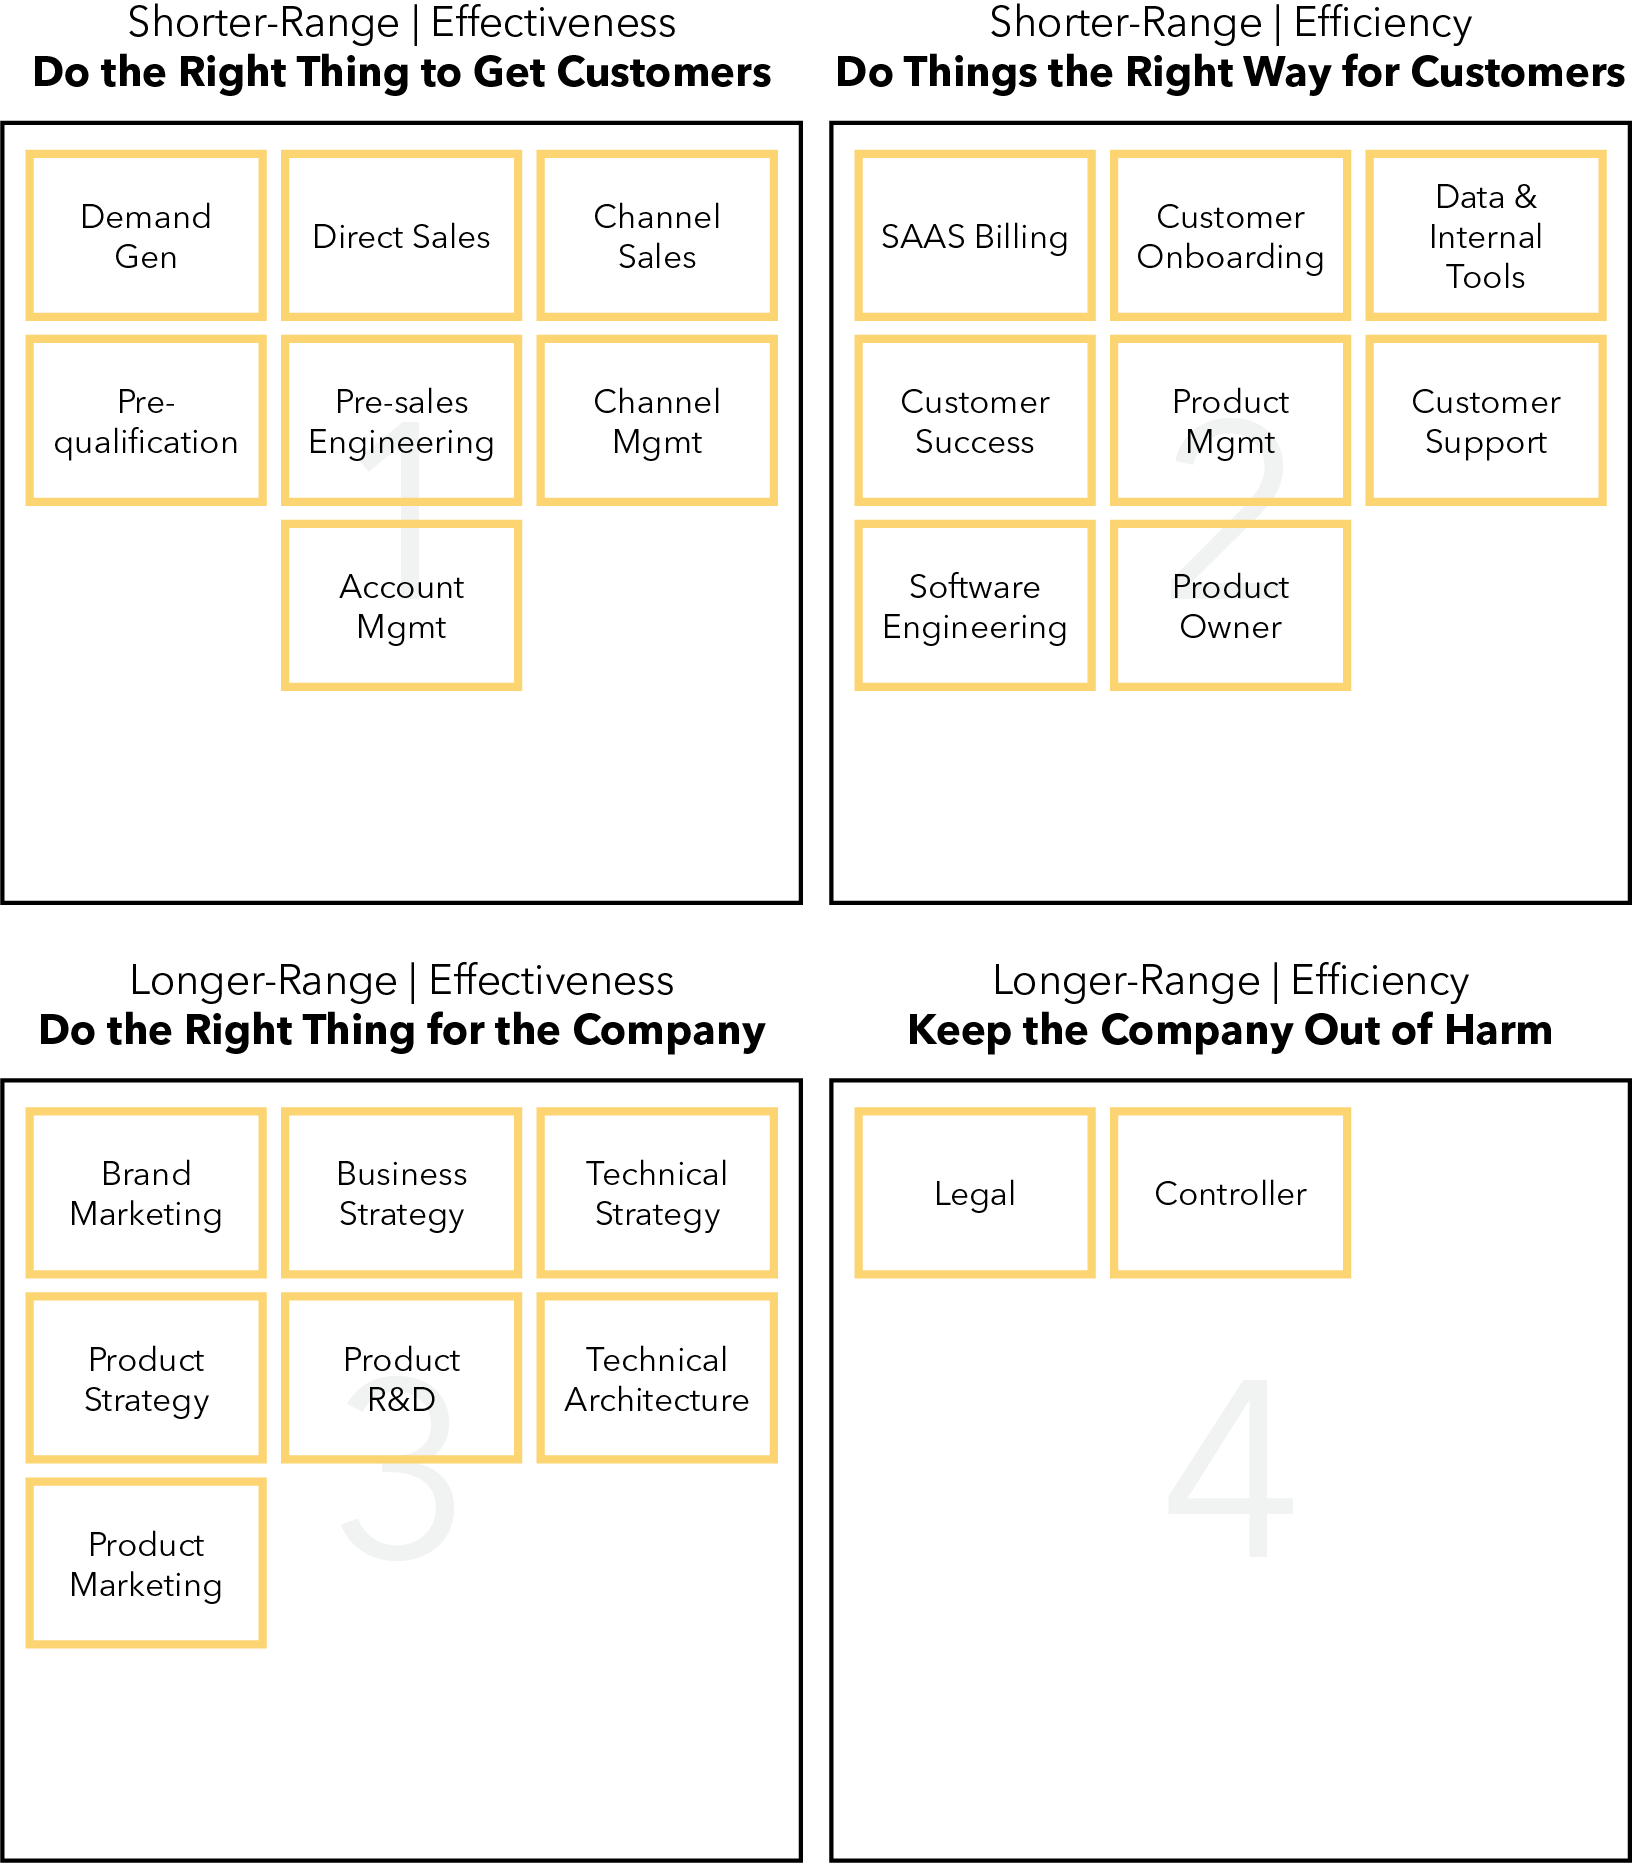 |
| Figure 32. PeoplePower Structure Map adding Product Owner and Software Engineering into Quadrant 2 and Product Marketing into Quadrant 3. |
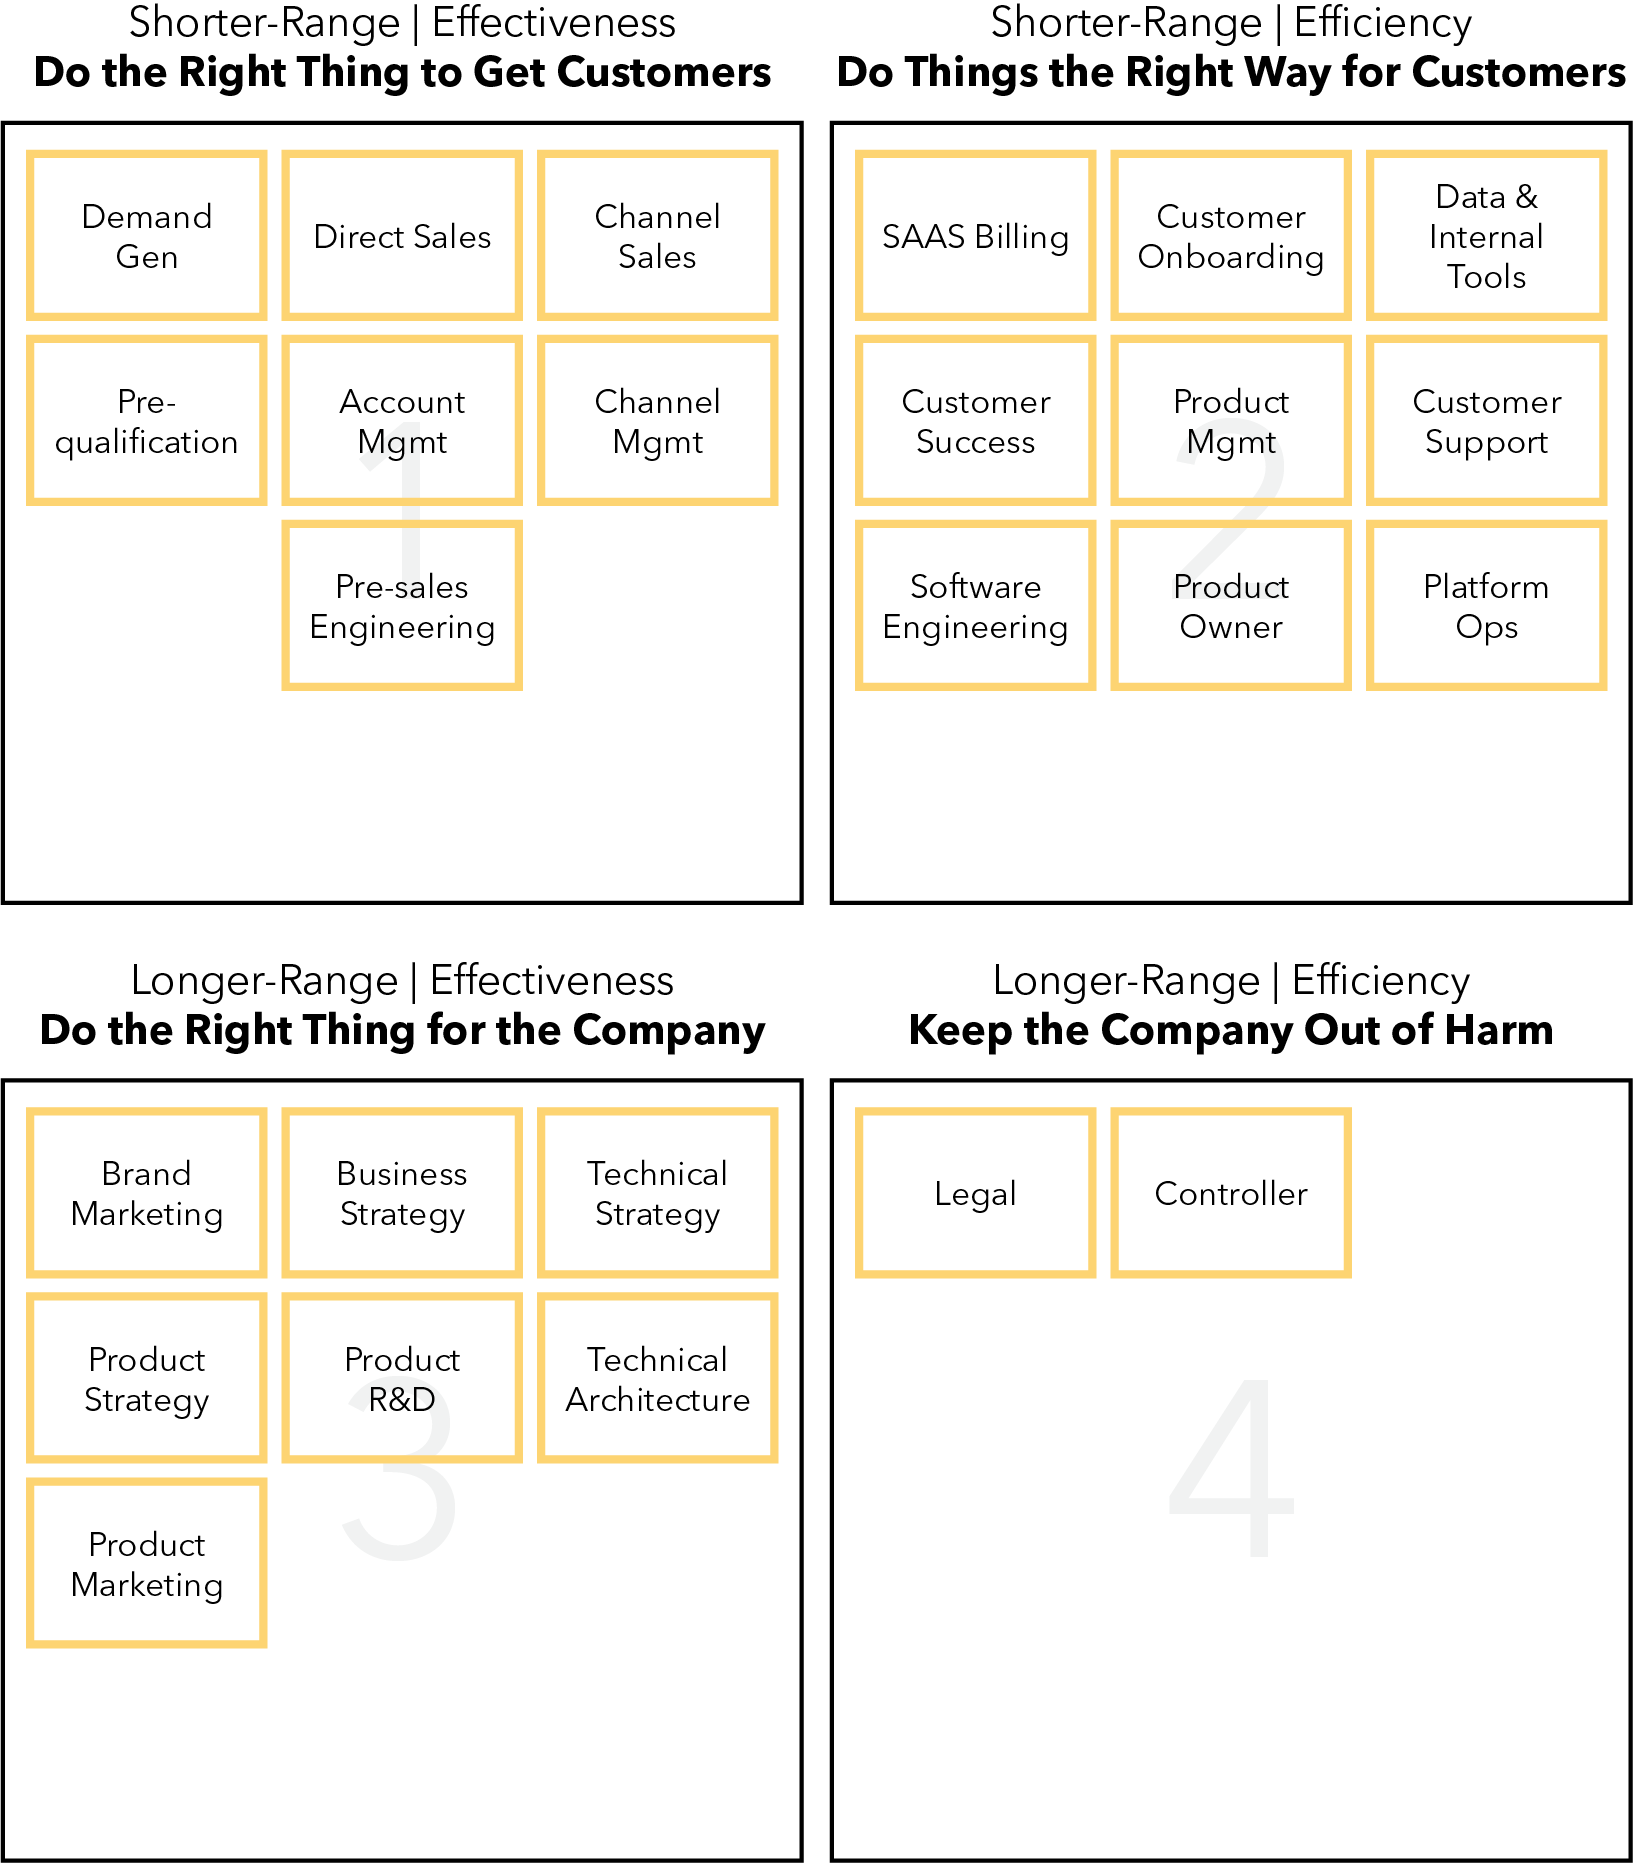 |
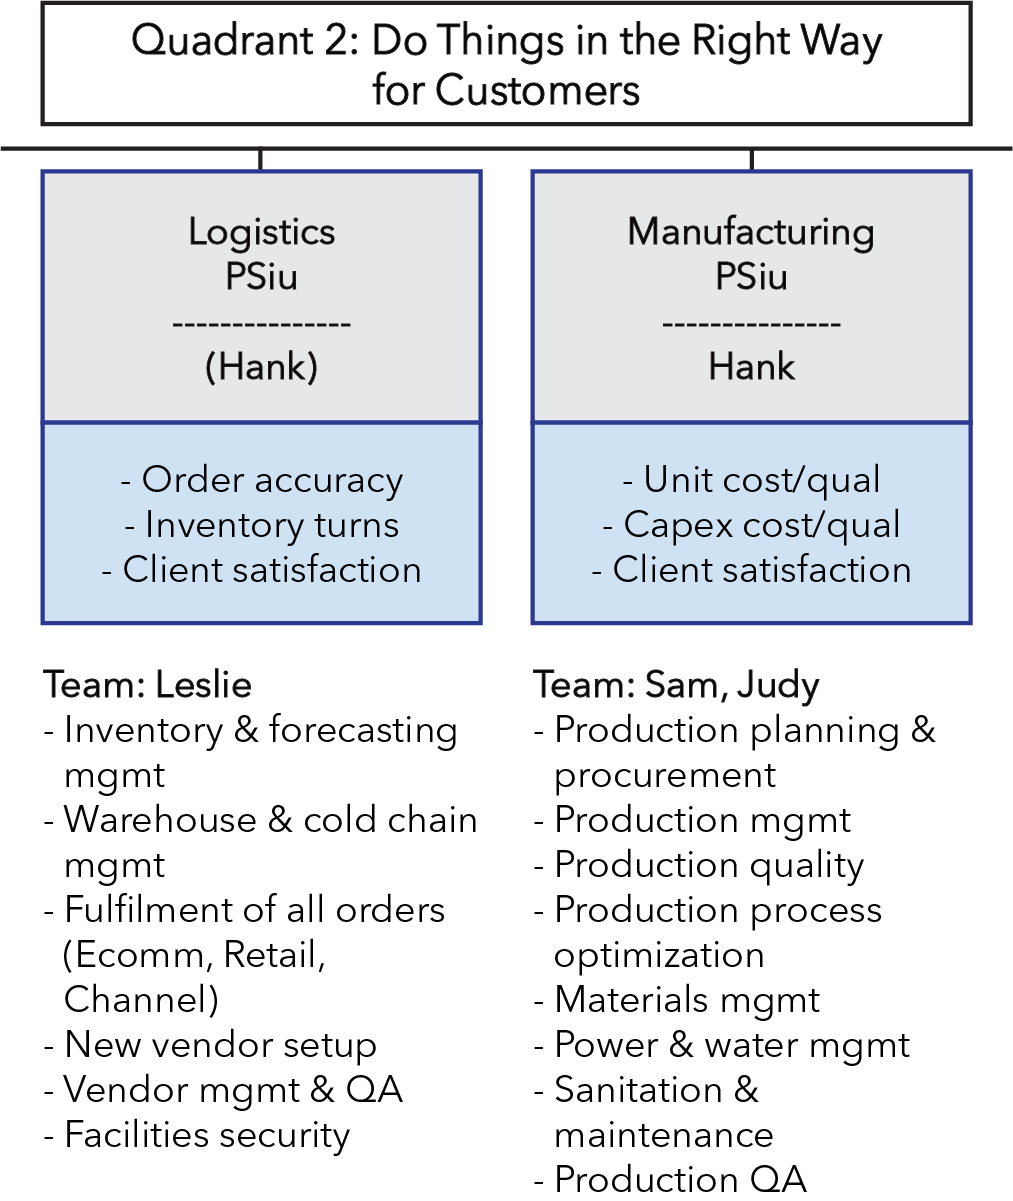
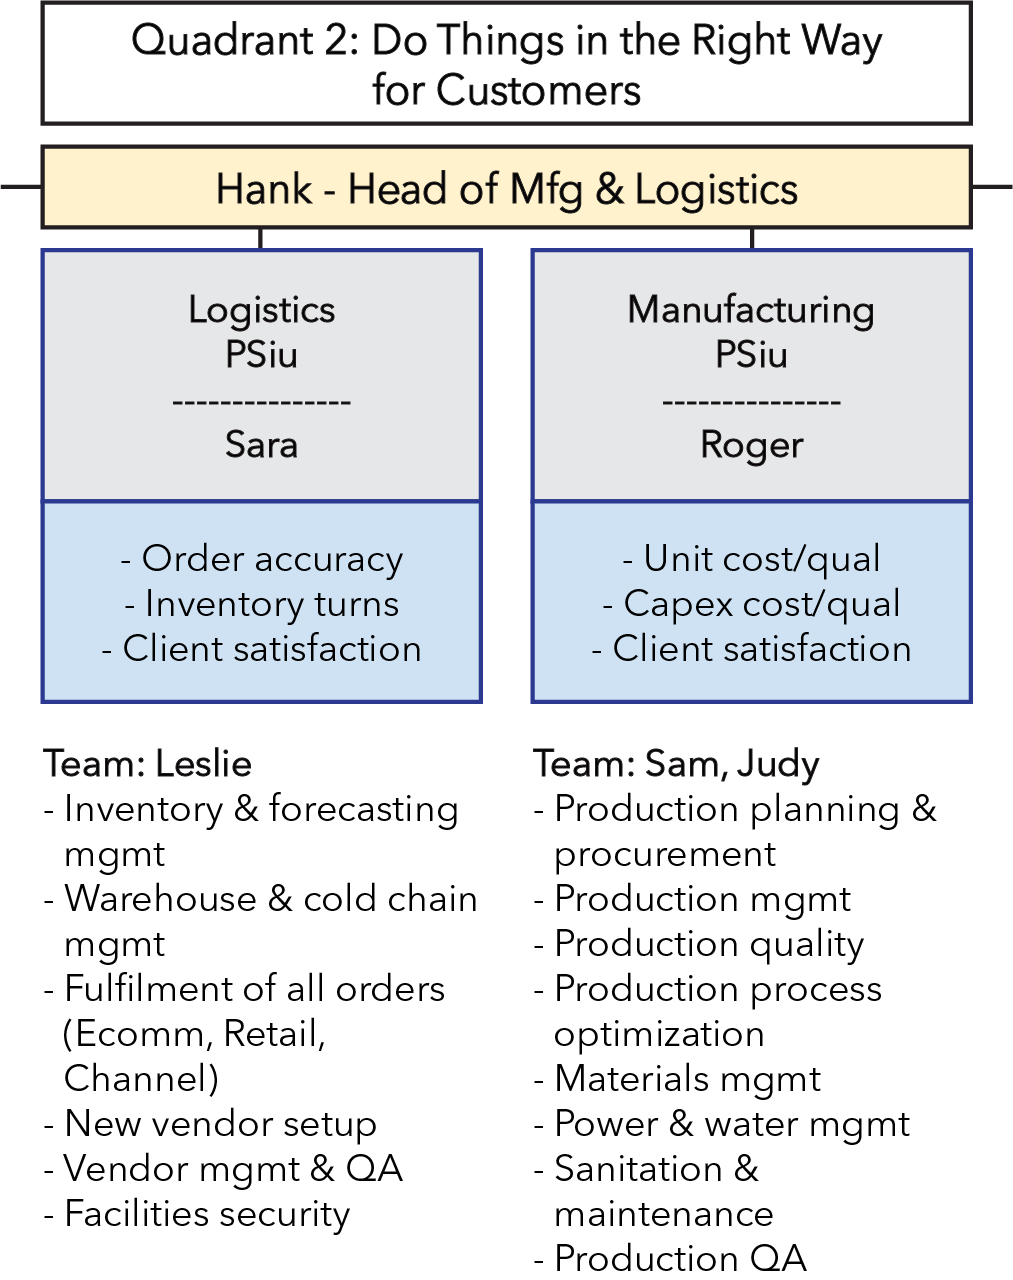
| Figure 33. PeoplePower Structure Map adding Platform Operations to Quadrant 2. |
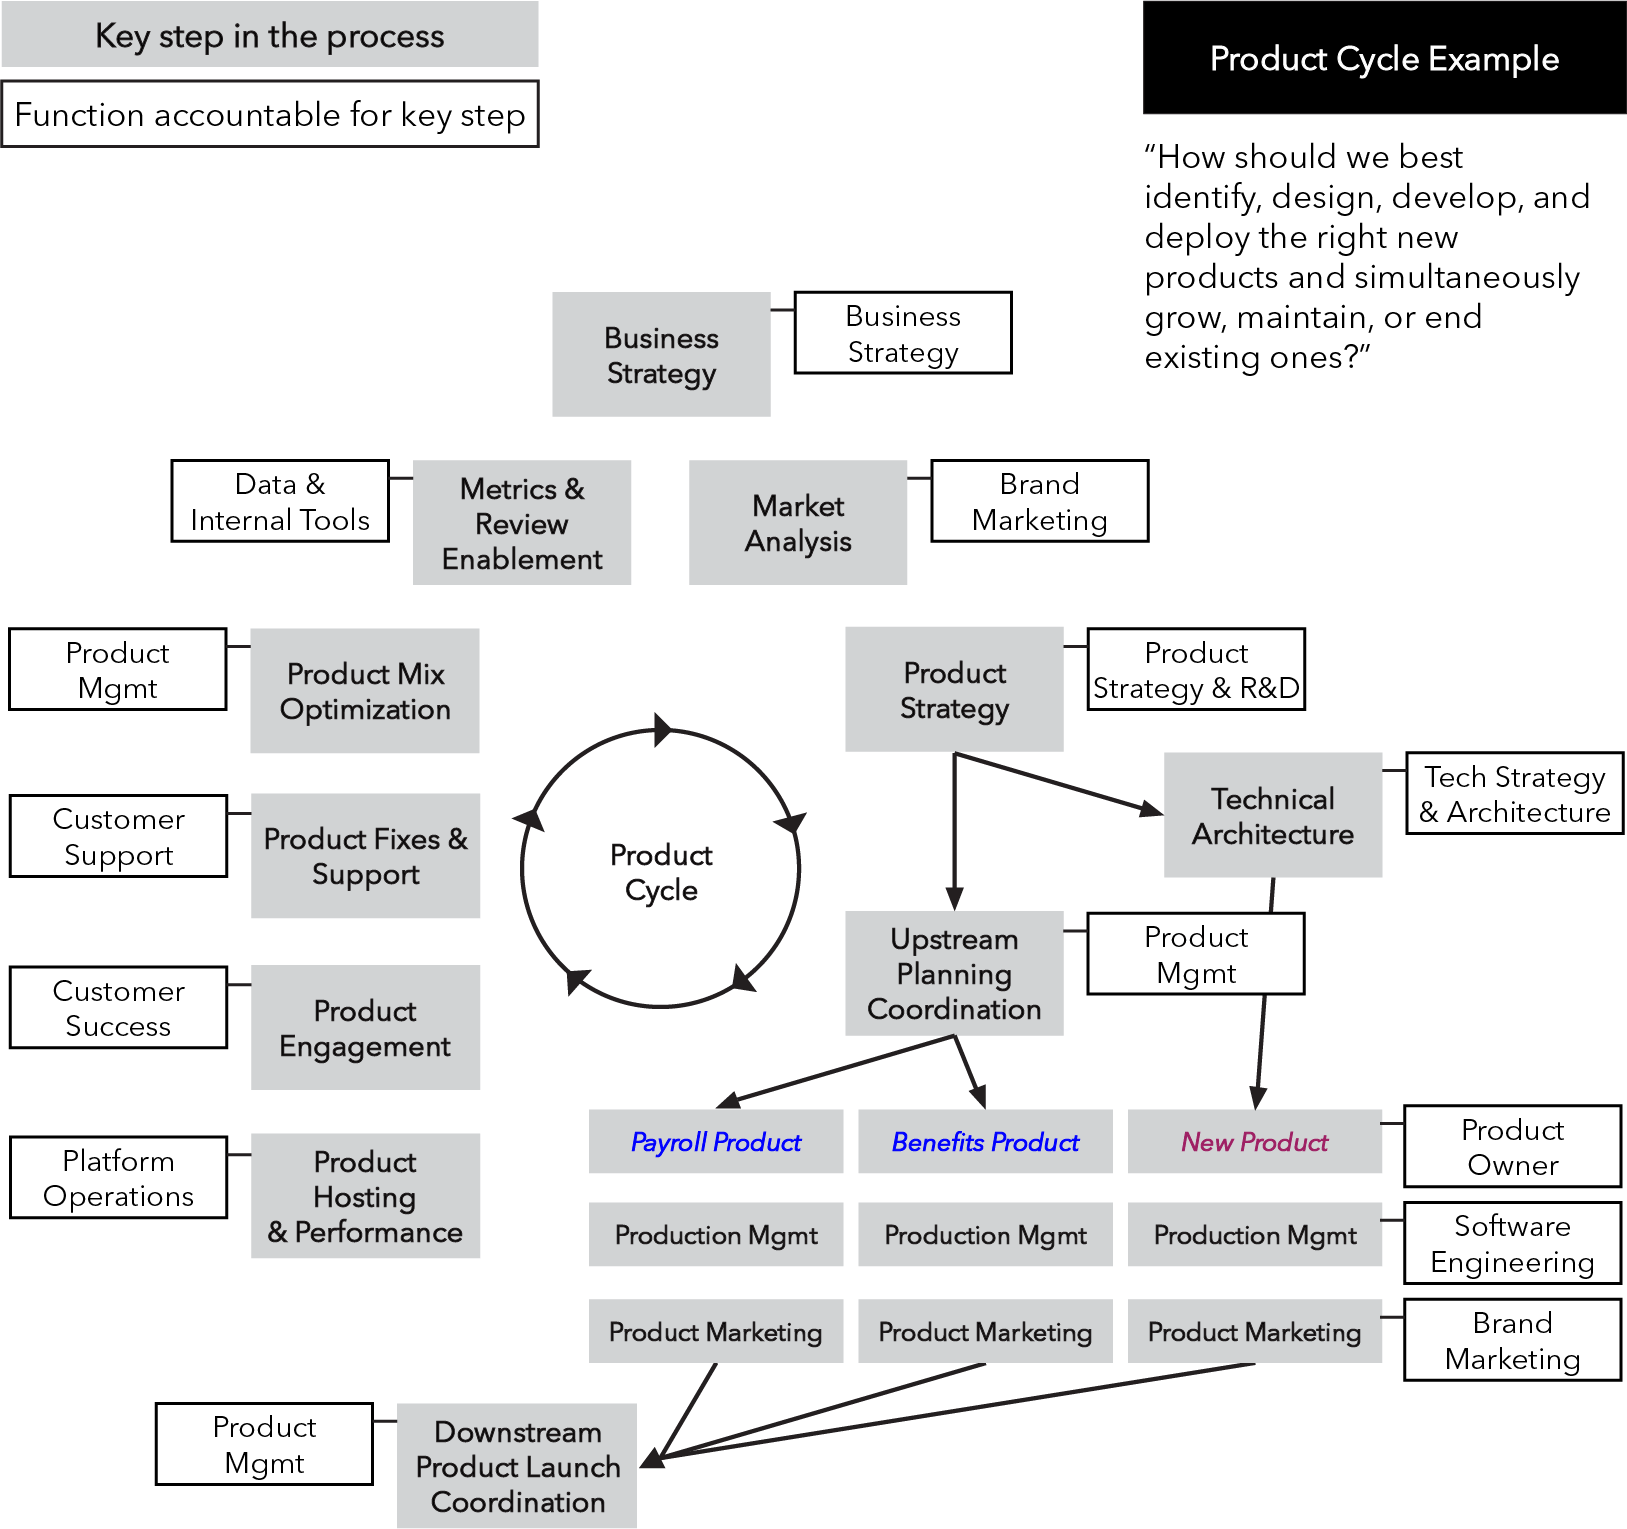 |
| Figure 34. PeoplePower Product Development Cycle with accountabilities. |
 |
| Figure 35. PeoplePower Structure map adding Culture & Talent to Quadrant 3 and HR Admin to Quadrant 4. |
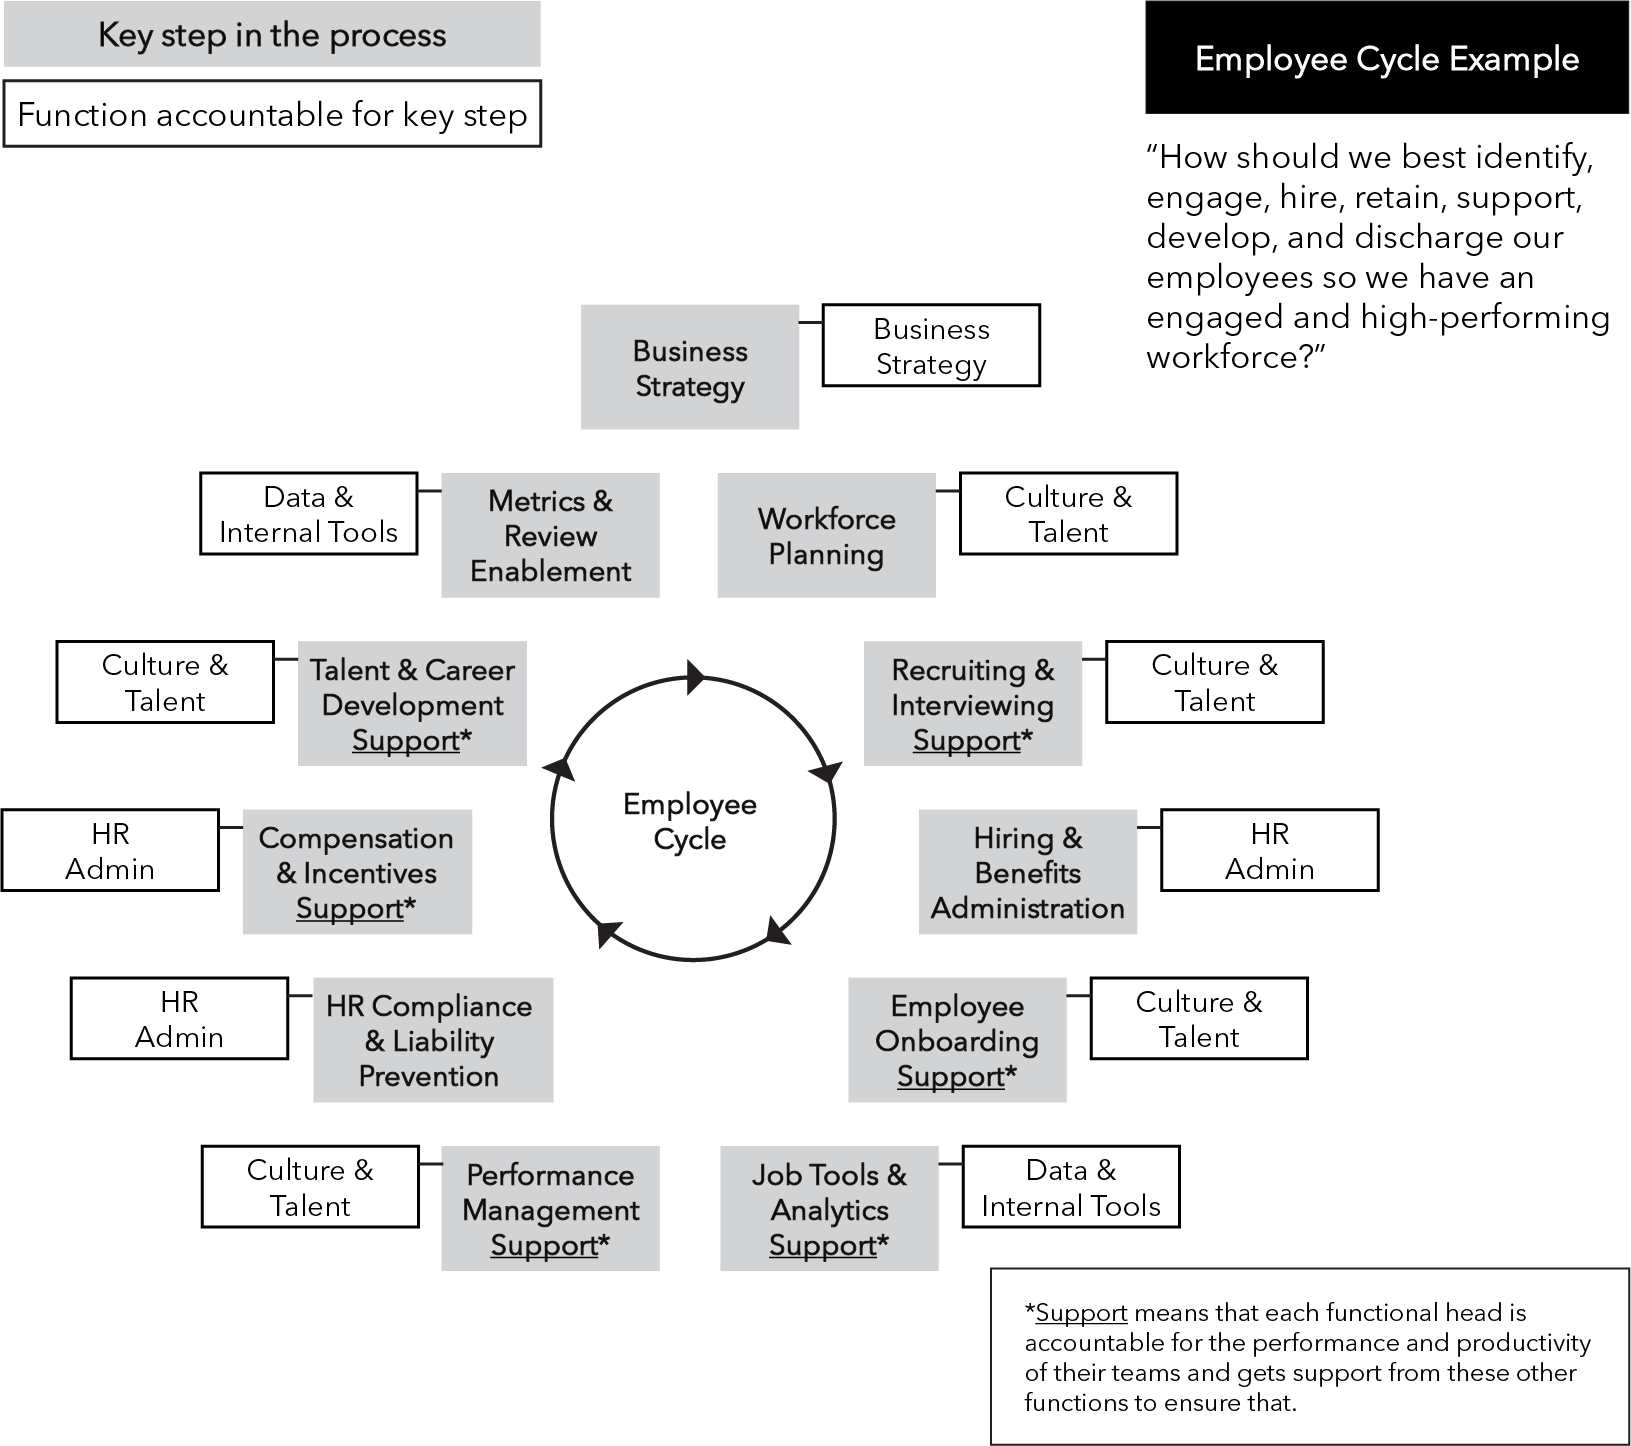 |
| Figure 36. PeoplePower Employee Cycle with accountabilities. |
 |
| Figure 37. PeoplePower Structure Map Exercise with Business Alignment in Quadrant 2 and Strategic Finance in Quadrant 3. |
Chapter 9 |
 |
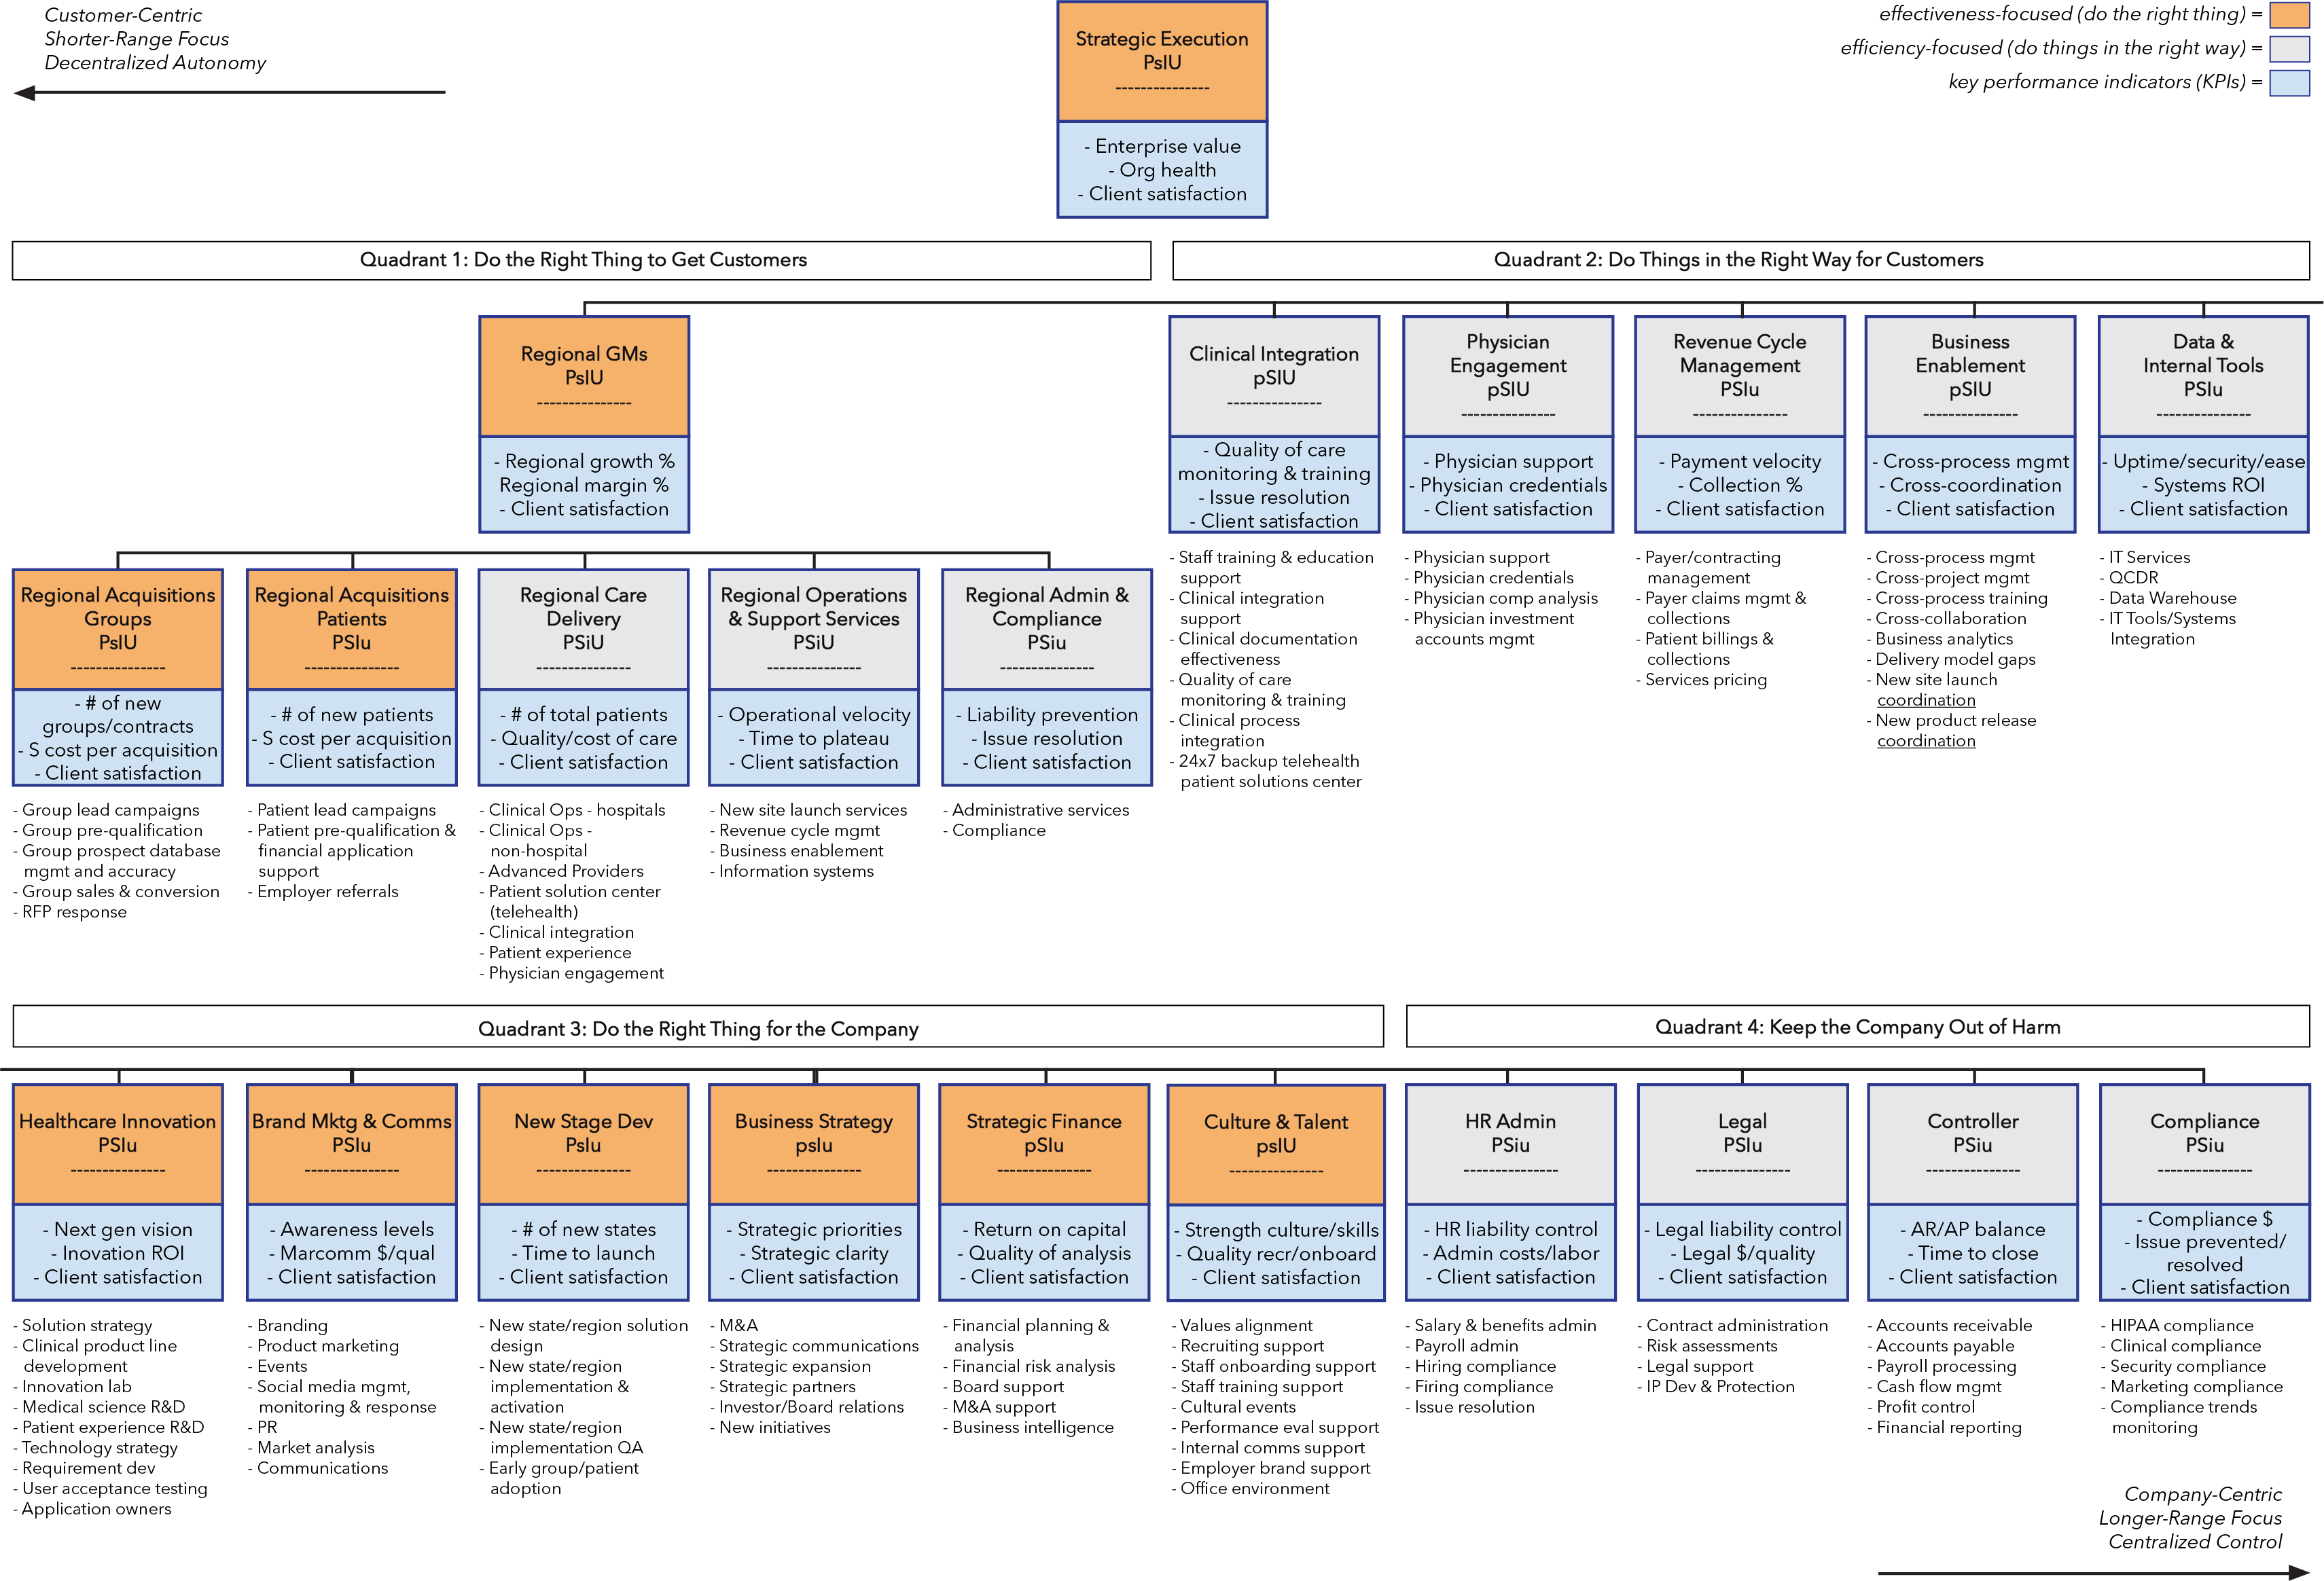
| Figure 38. PeoplePower’s completed draft of its Structure Map. |
 |
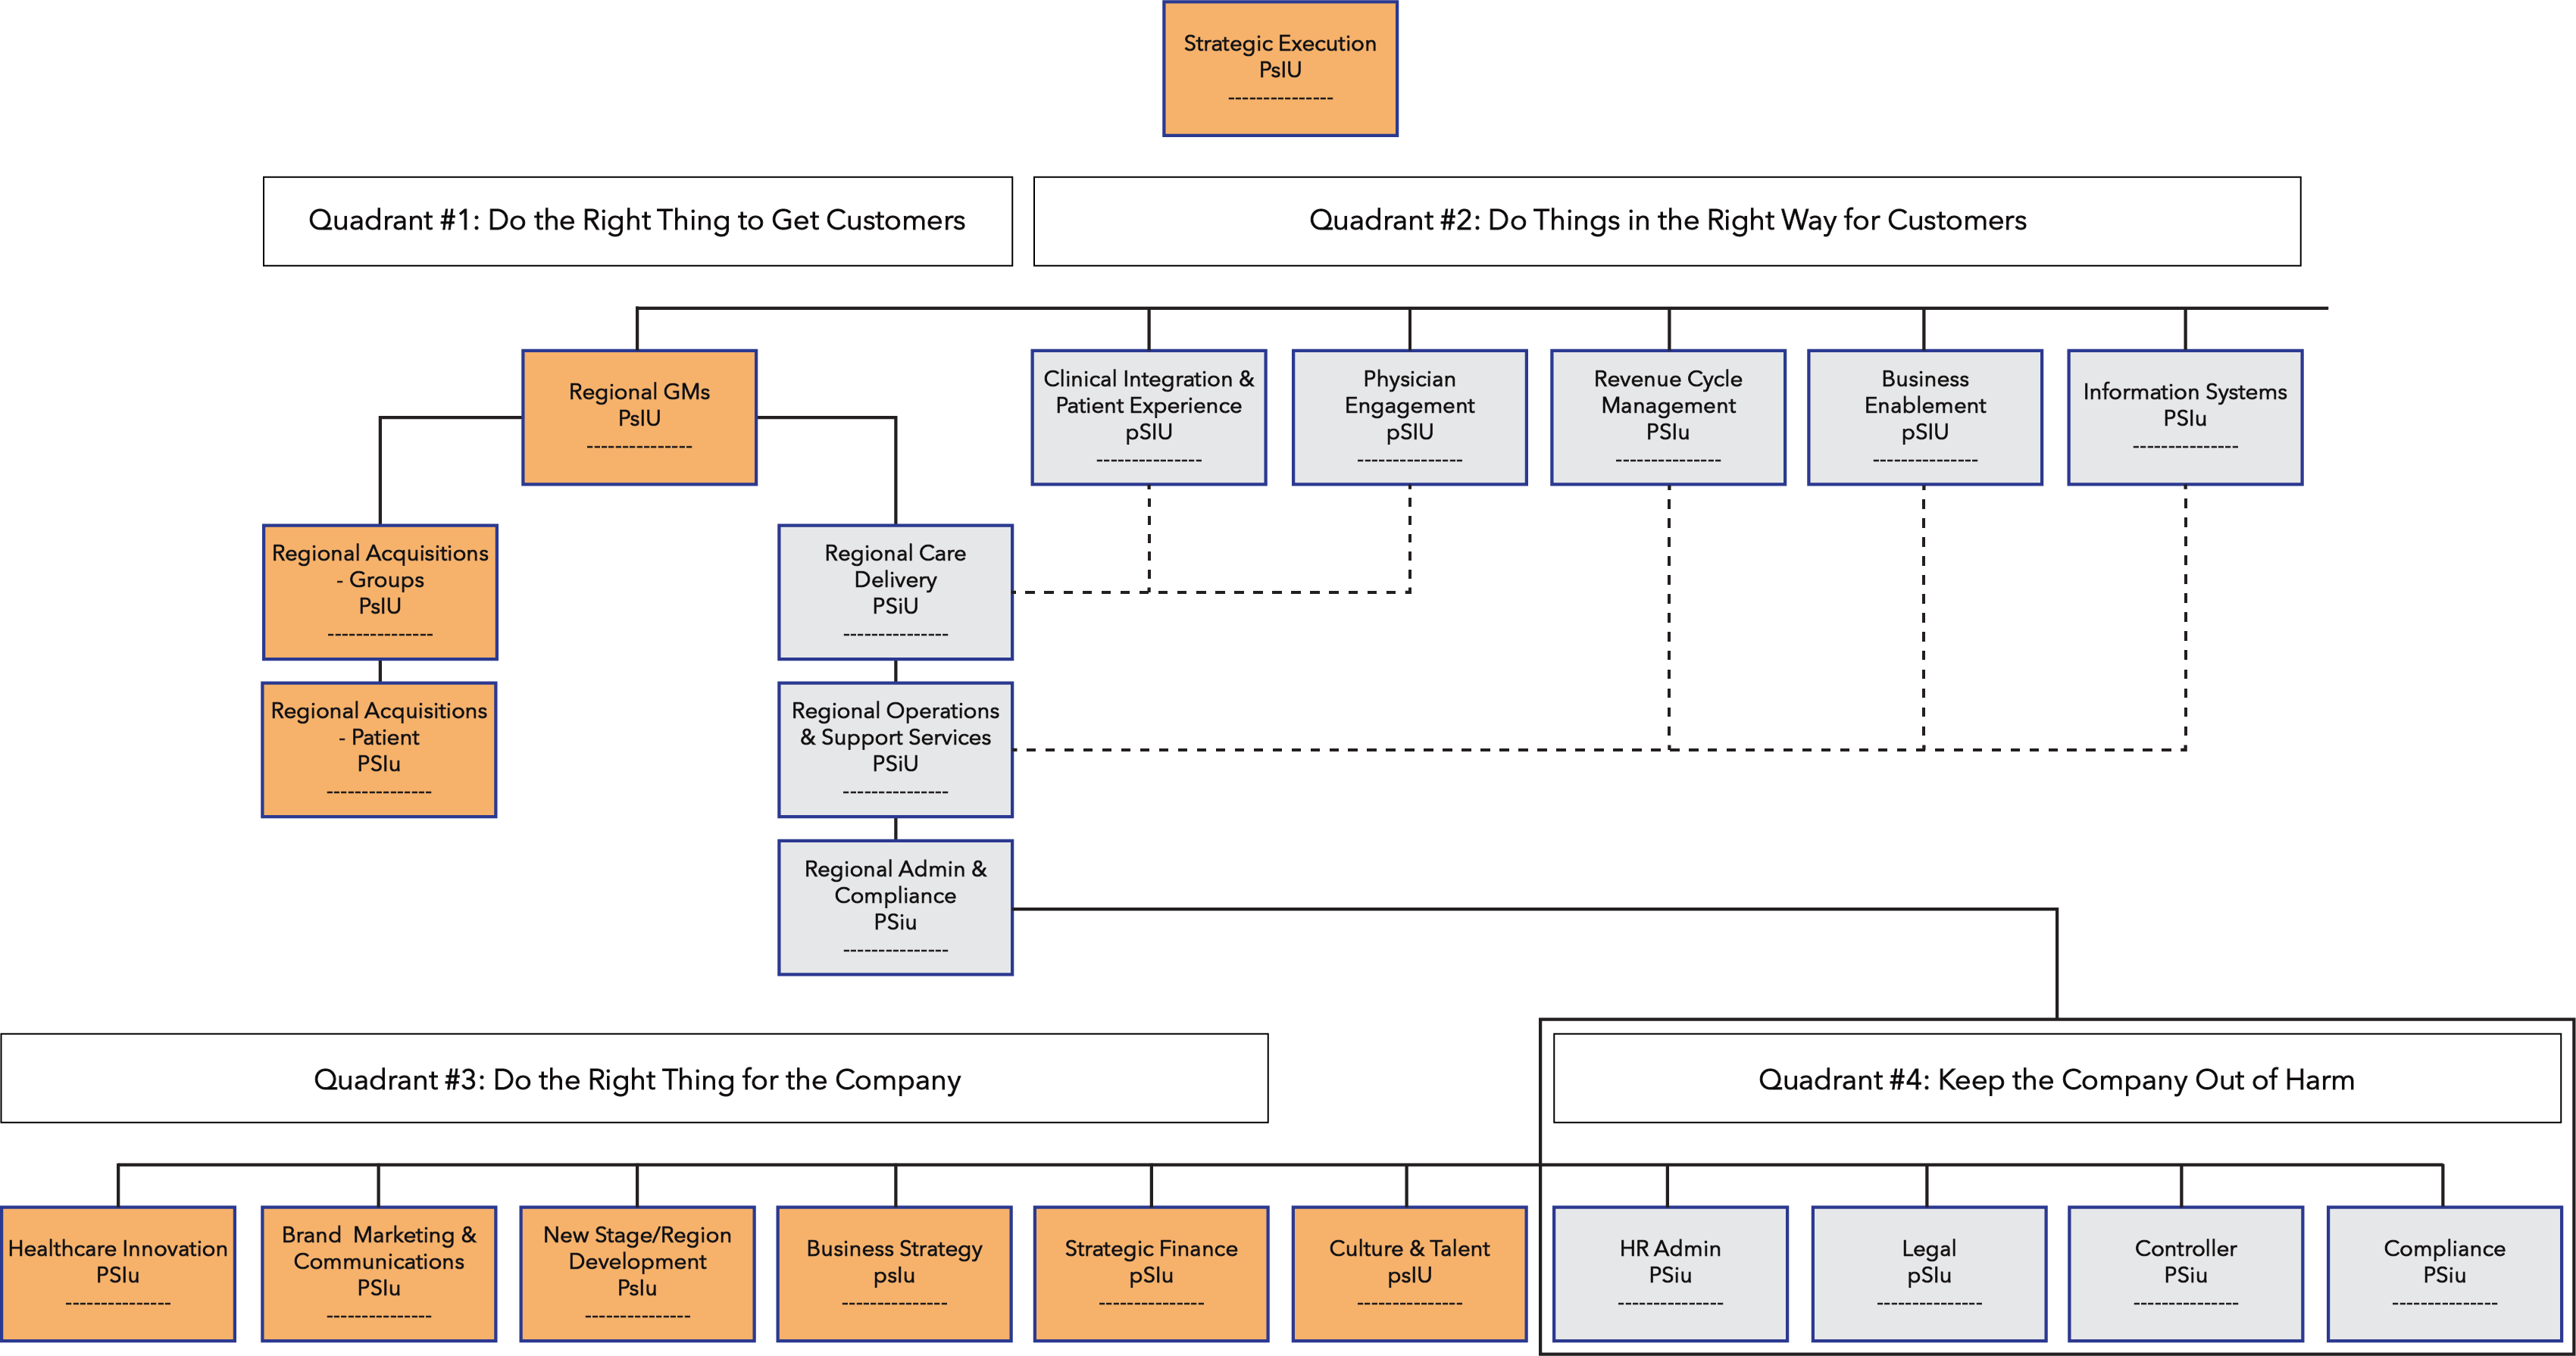
| Figure 39. New PeoplePower draft structure. |
Chapter 10 |
 |
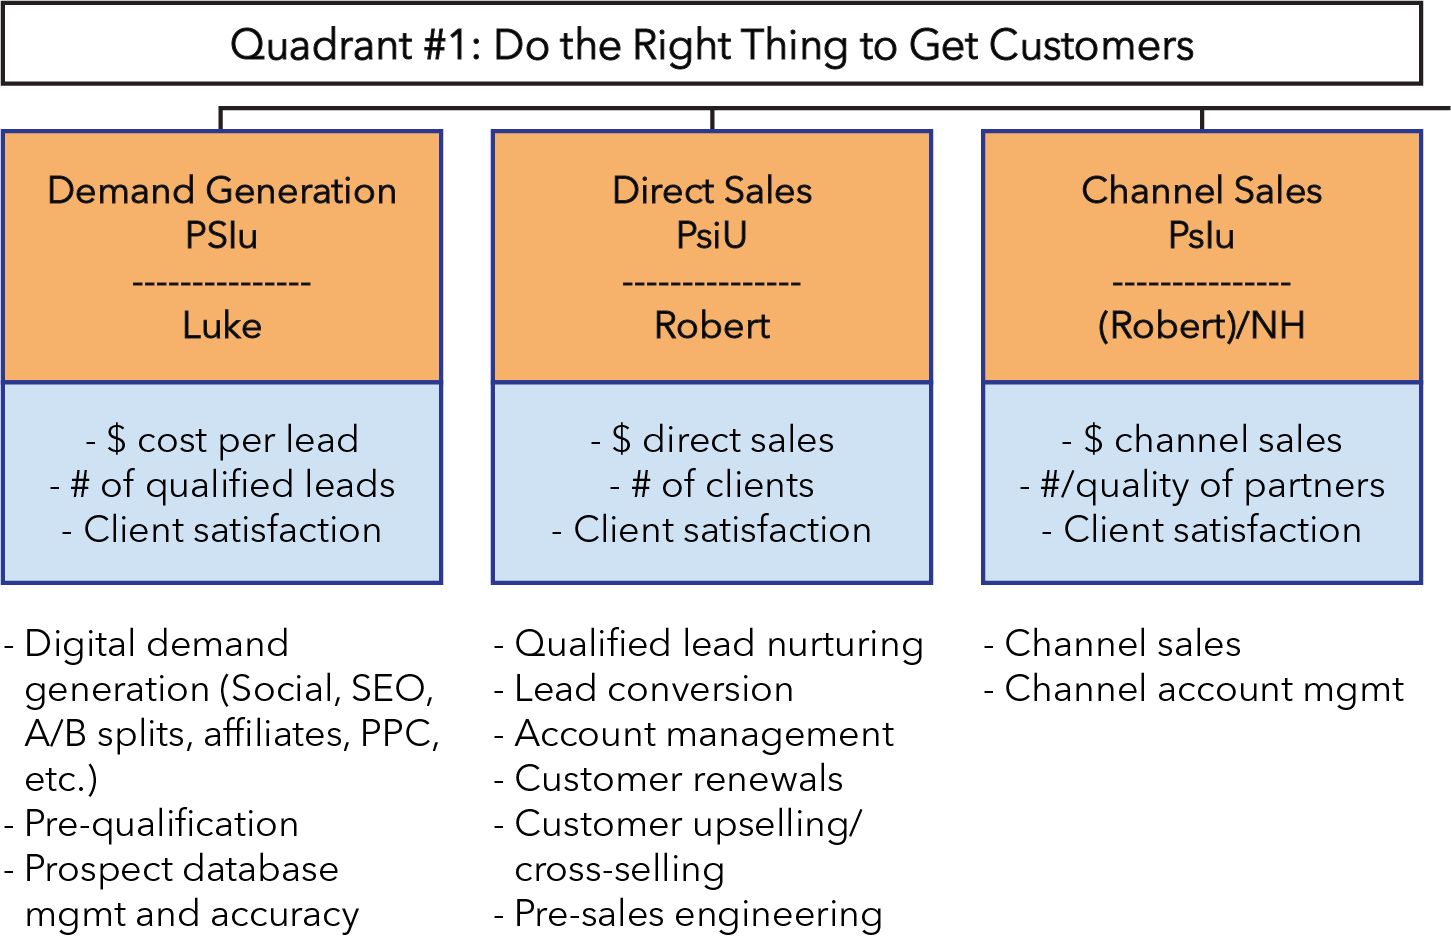
| Figure 40. Example of Quadrant 1 without a direct sales function. |
 |
| Figure 41. Example of a Divisional/Regional Structure. |
 |
| Figure 42. Example of a Matrix Structure. |
Chapter 12 |
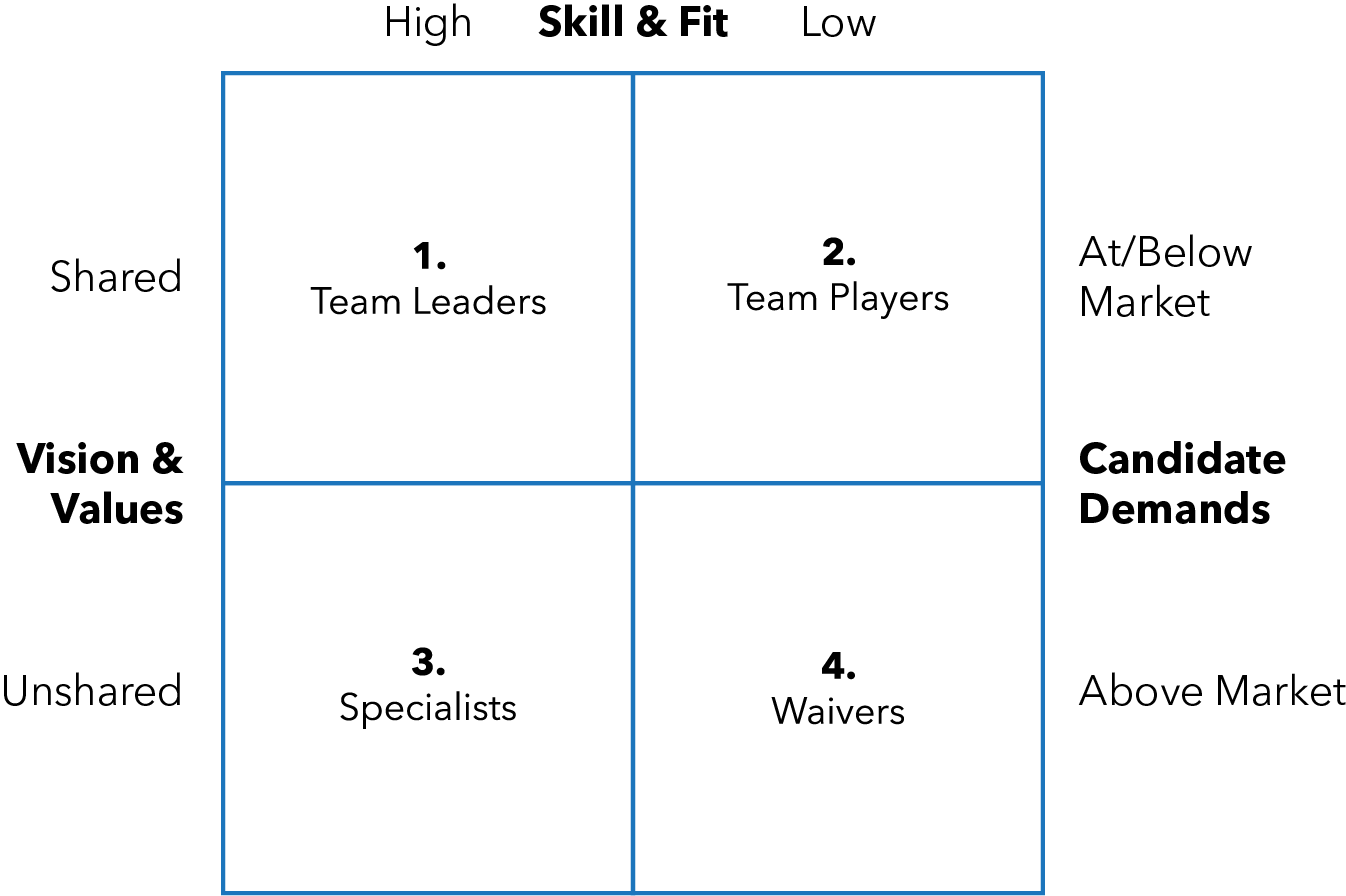 |
| Figure 43. The Draft Board from my book How to Think About Hiring. |
 |
| Figure 44. Put people into roles where they can focus and thrive. |
 |
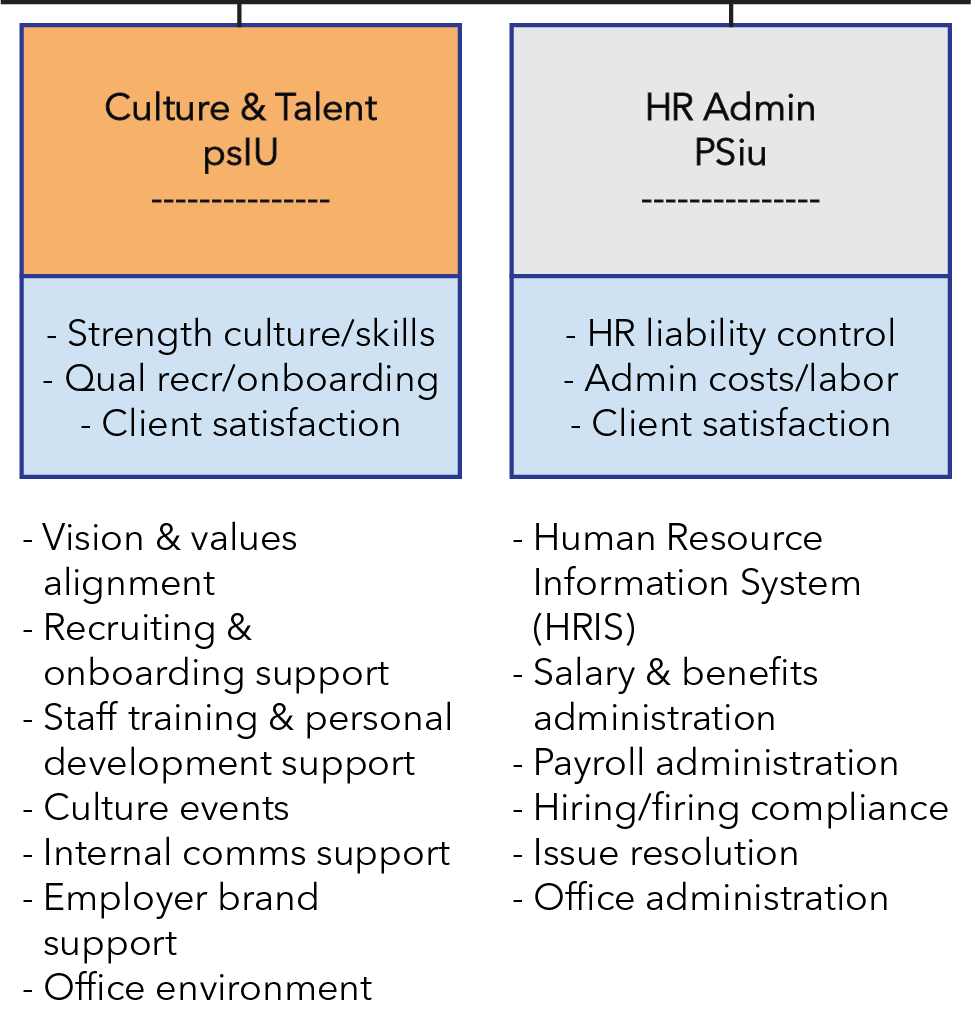
| Figure 45. Culture & Talent vs. HR Admin with the same player. |
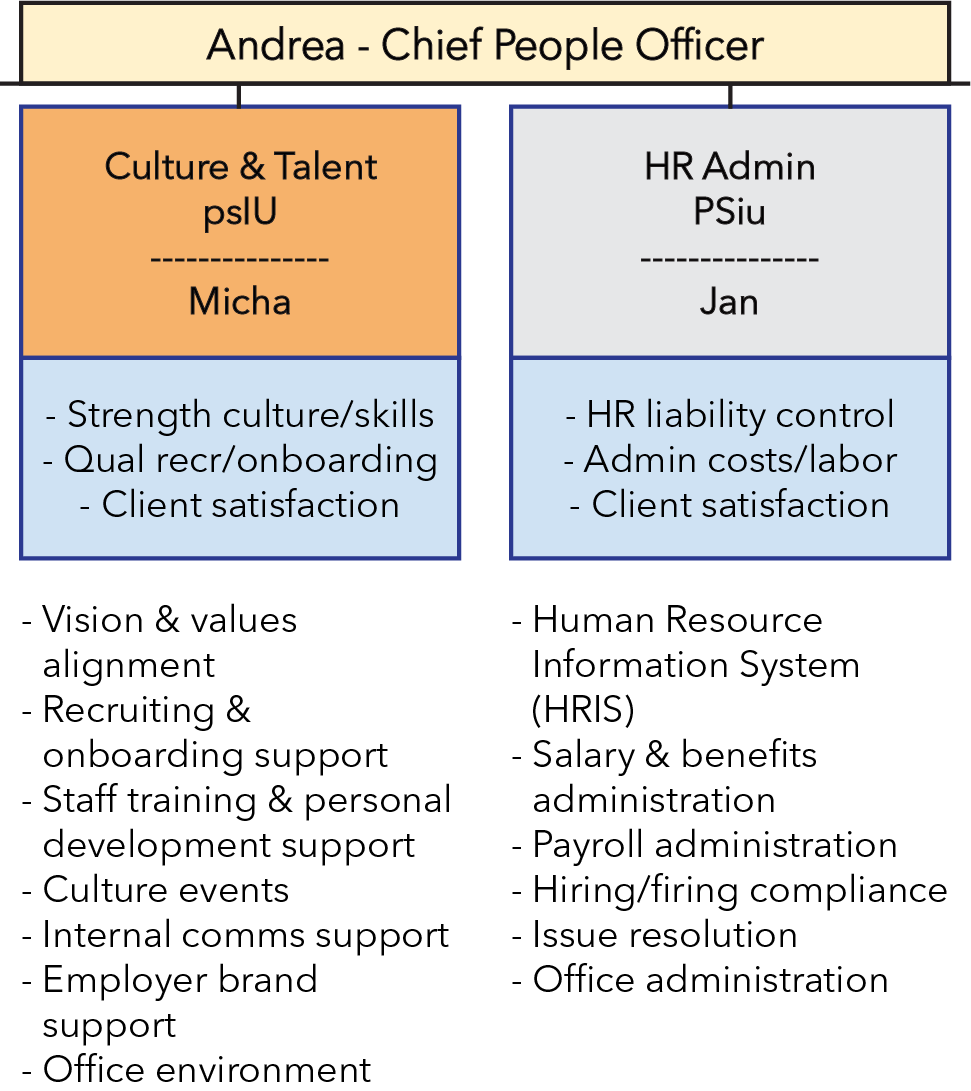 |
| Figure 46. Consolidating Culture & Talent vs. HR Admin under a Chief People Officer. |
 |
| Figure 47. Culture & Talent vs. HR Admin role focus. |
 |
| Figure 48. How Charlie staffed Quadrant 1 for PeoplePower. |
Chapter 13 |
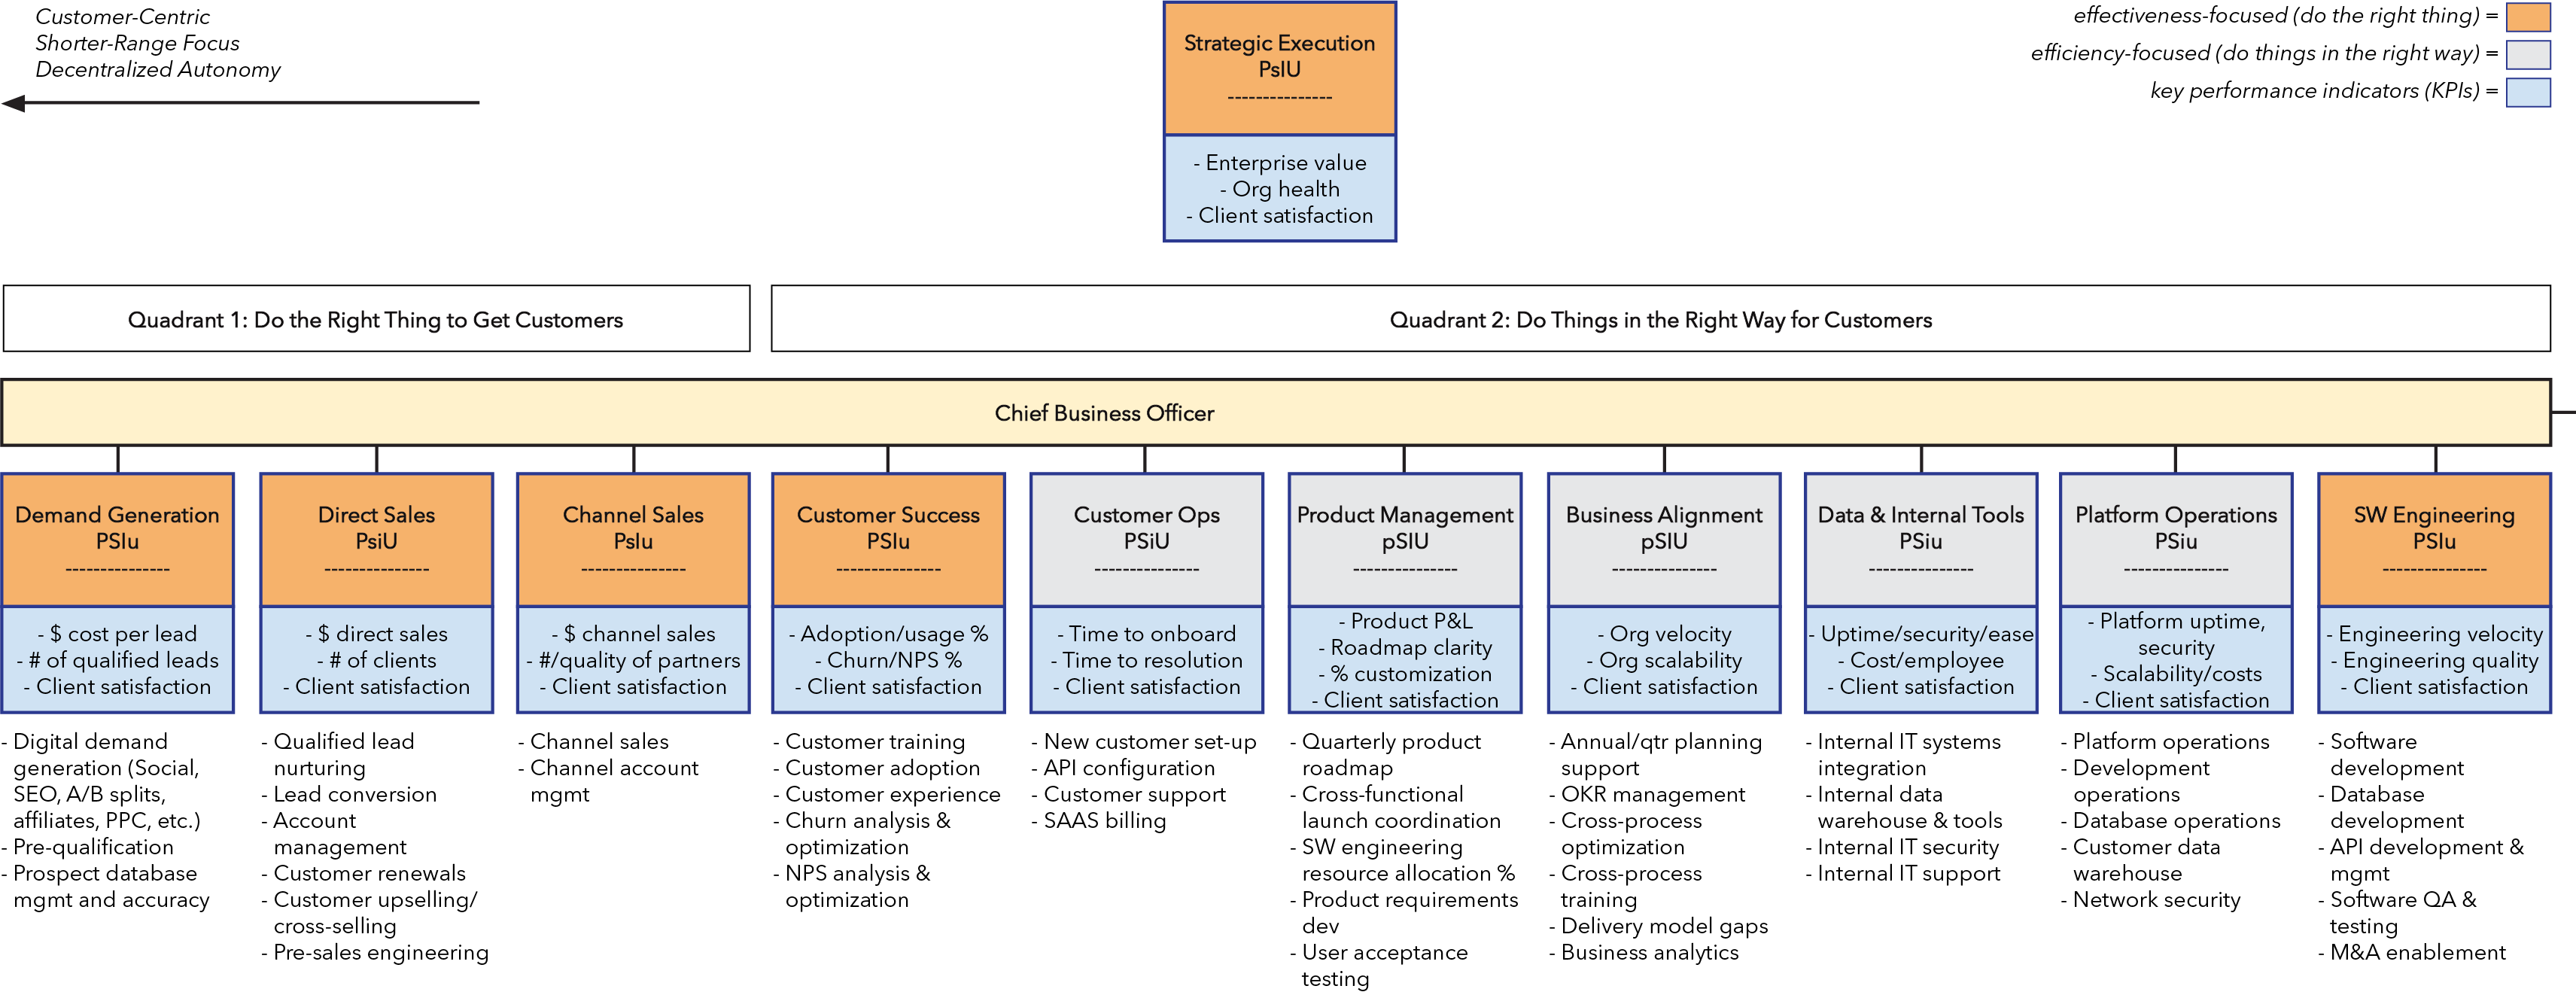 |
| Figure 49. Shows a common consolidation move for a Chief Business Officer to oversee all of sales and delivery. |
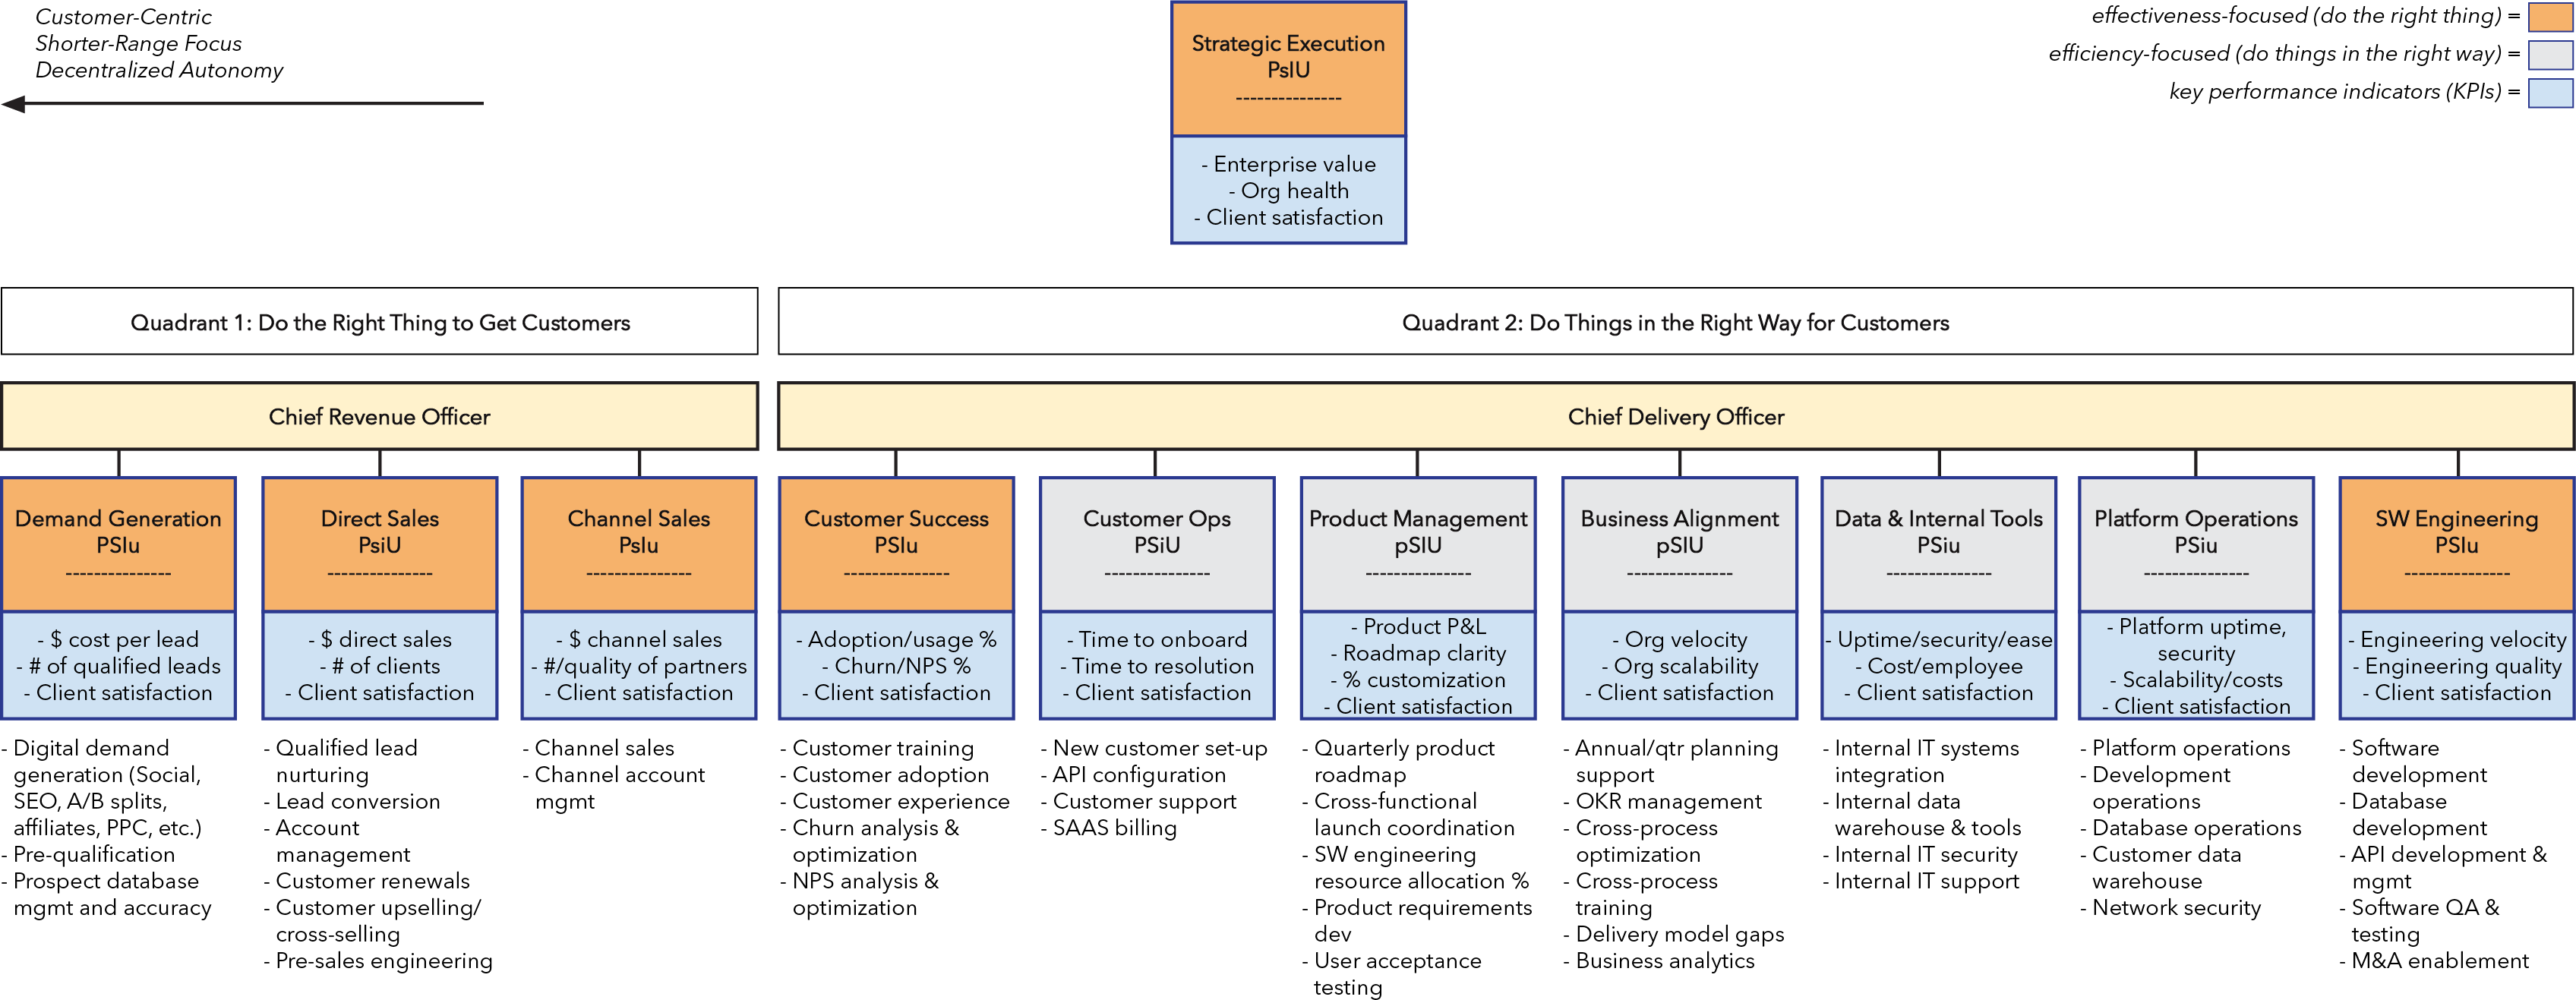 |
| Figure 50. It is safer to consolidate within a single quadrant. |
 |
| Figure 51. Assigning (hats) within a quadrant is generally safer. |
 |
| Figure 52. Beware of the Queen of England. |
 |
| Figure 53. Example of how to assign (hats) within a quadrant. |
 |
| Figure 54. Example of consolidating within a quadrant. |
Chapter 16 |
 |
| Figure 55. The Leadership Team (LT) Process. |
Chapter 19 |
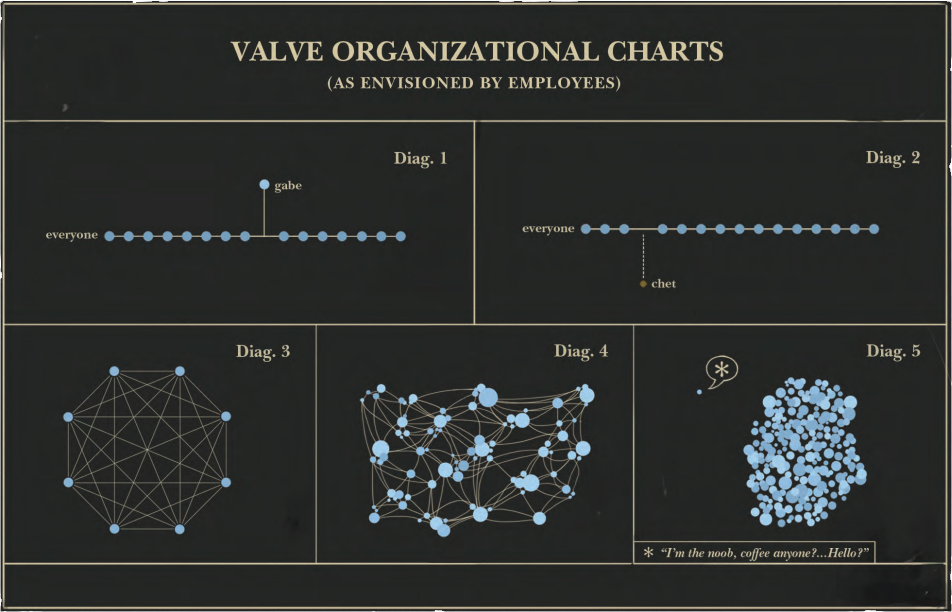 |
| Figure 56. Excerpt from the Valve New Employee Handbook. |
Appendix B |
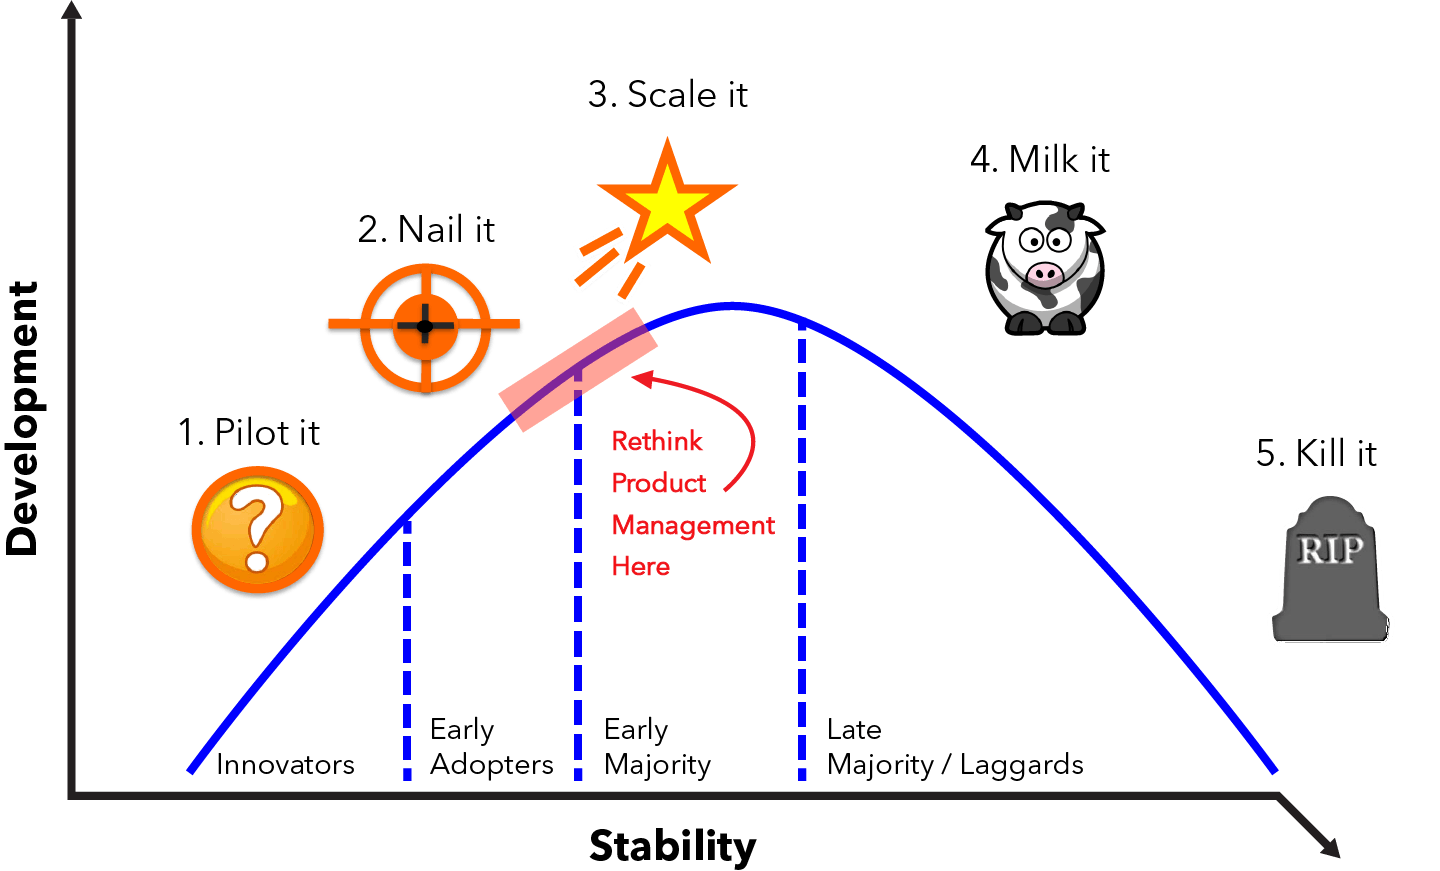 |
| The stage between late Nail It and early Scale It usually requires a new approach to Product Management. |
Appendix C |
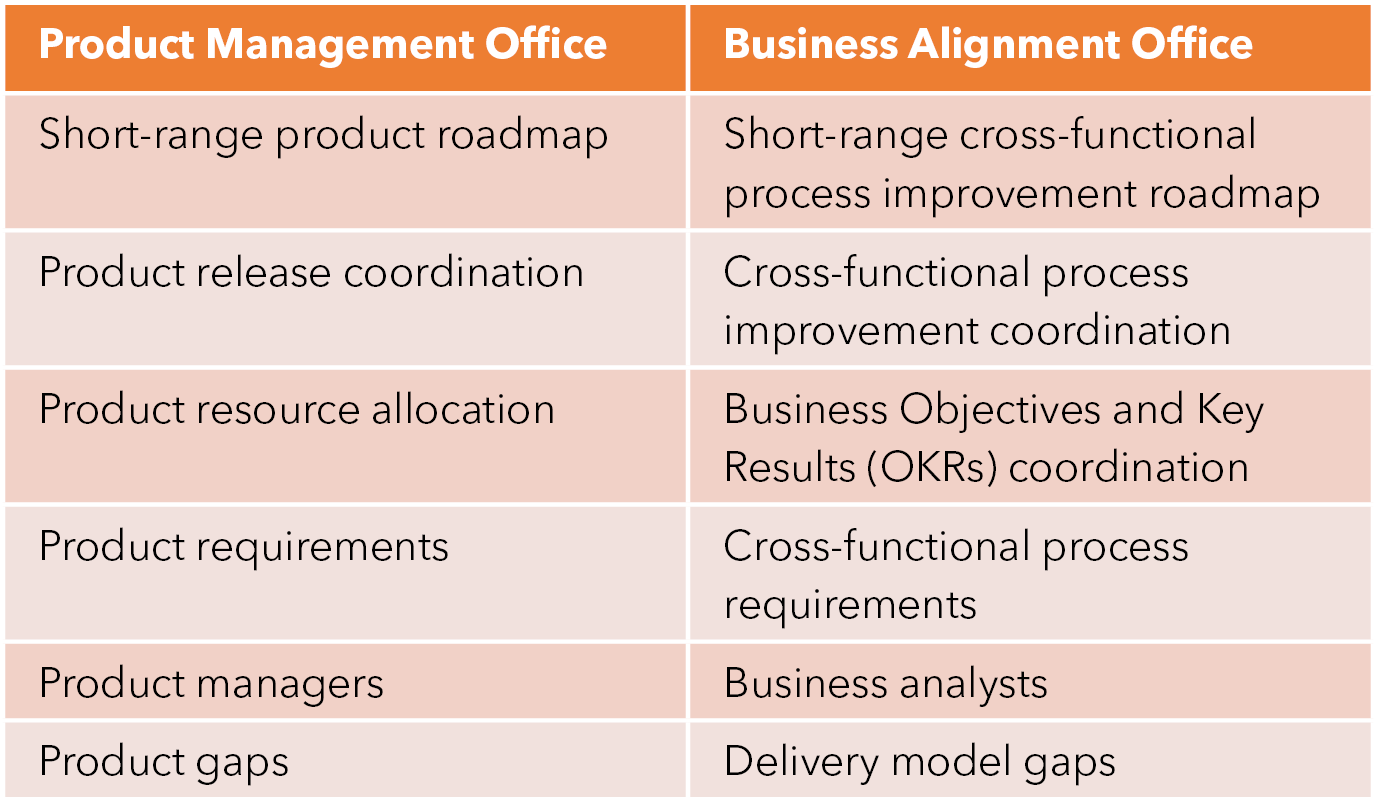 |
| Figure 58. Comparing Product Management with Business Alignment. |
Designed to Scale Audio Book ImagesLex Sisney2022-03-05T09:07:49-08:00